The best-in-class bus fleet operations in the U.S. share a common infrastructure: systematic preventive maintenance, digital work order management, comprehensive parts inventory, technician training programs, and data-driven asset management. These fleets achieve 92-96% vehicle availability, reduce maintenance cost per mile by 15-25% compared to industry average, prevent 35-45% more accidents through proactive safety maintenance, and maintain technician retention rates 12-18% above industry baseline. The difference between top-performing fleets and average fleets is not expensive equipment or brand-new buses -- it is operational discipline and systematic execution of maintenance best practices. This guide covers the 10 maintenance best practices used by top-quartile U.S. school bus, transit, and charter fleets in 2026. Each practice is grounded in real data from 300+ fleet operations, includes implementation roadmap, and quantifies the performance impact. A fleet implementing just 5 of these practices will achieve measurably better vehicle availability, lower maintenance cost per mile, and improved safety outcomes within 12 months.
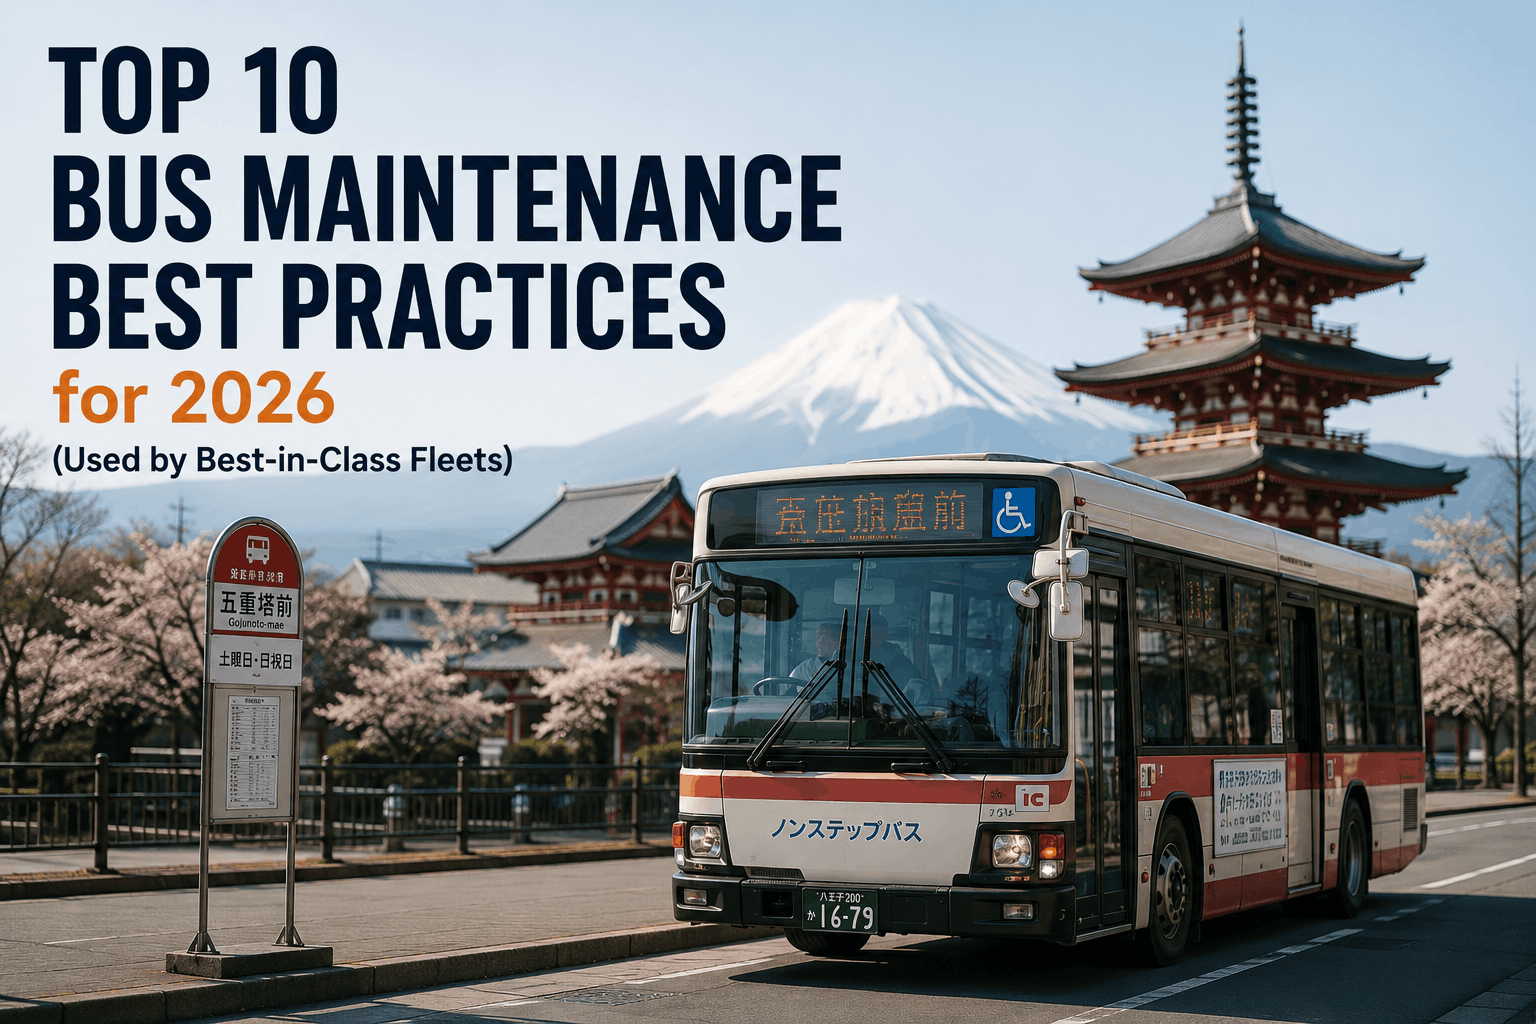
Top 10 Bus Maintenance Best Practices for 2026
Data-backed maintenance practices from the best-in-class fleets in North America. Achieve 94%+ vehicle availability, reduce cost per mile, and build predictable maintenance budgets. Proven across school districts, transit agencies, and charter operators.
Preventive Maintenance Compliance 90%+
Top-performing fleets achieve and maintain PM compliance rates of 90-96%, meaning 90-96% of scheduled preventive maintenance is completed on schedule. This requires: clear PM schedules tied to mileage (not just calendar), assigned responsibility for PM completion, and consequences for deferred PM. Fleets that achieve 90%+ compliance reduce unplanned downtime by 20-30% because failures are prevented before they occur. Implementation: use CMMS to schedule PM, track completion percentage monthly, and escalate missed PM schedules to the maintenance manager within 7 days. Impact: 20-30% reduction in unplanned downtime, improved fleet availability, lower warranty claim denial rates due to better preventive maintenance documentation.
Digital Work Orders and CMMS Integration
All maintenance work (PM, repairs, inspections) is documented in a CMMS, not on paper forms. Digital work orders create a permanent maintenance record for each vehicle, enable real-time status tracking, and provide data for trend analysis. Paper-based maintenance operations create silos: the maintenance shop knows what work was done today, but nobody knows what work was done 6 months ago. CMMS integration enables fleet-wide visibility, predictive maintenance, and cost tracking. Implementation: select CMMS (BusCMMS recommended for bus fleets), train all maintenance staff on data entry, and require work order closure with completion notes before technicians move to next job. Impact: 15-25% improvement in technician efficiency, 30-40% reduction in communication gaps, ability to track cost per vehicle and identify high-cost patterns.
Predictive Maintenance on Critical Systems
Top fleets use AI-powered predictive maintenance on brake systems, transmission, and engine to flag maintenance needs 4-8 weeks in advance, enabling scheduled maintenance rather than emergency repairs. Predictive brake maintenance detects wear patterns early, predictive transmission analysis flags filter change needs, and engine diagnostics identify fuel system or cooling issues before failures occur. This shifts 30-40% of reactive maintenance to proactive scheduled maintenance. Implementation: deploy telematics/sensor monitoring on all vehicles, integrate with CMMS for automatic work order generation when predictions flag upcoming service, and track prediction accuracy monthly to refine models. Impact: 25-35% reduction in emergency maintenance calls, 15-20% lower maintenance cost per mile, 35-45% reduction in accident rates (especially brake-related).
Planned Parts Inventory Management
Maintain parts inventory levels based on usage data and supplier lead times, not historical habit. Top fleets track parts consumption per vehicle type, forecast demand 60-90 days out, and maintain safety stock levels that prevent stockouts while minimizing excess inventory. This balances two costs: emergency ordering costs (rush charges, expedited shipping) and carrying costs (capital tied up in excess inventory). Implementation: analyze 12-month parts consumption data by item, calculate reorder points based on usage rate and vendor lead time, set minimum and maximum stock levels in CMMS, and review quarterly as demand changes. Impact: 20-30% reduction in parts inventory value without increasing stockouts, 60-70% reduction in emergency parts orders, 10-15% cost reduction in parts procurement.
Technician Training and Certification Programs
Top fleets require ongoing technician training: annual ASE certification for lead technicians, diesel engine diagnostics training, brake system training specific to your fleet's brake type, and CMMS training. Experienced technicians complete repairs 20-30% faster than untrained technicians and make fewer quality errors. Fleets that invest in technician development have 10-15% lower turnover. Implementation: budget $2,000-$3,500 per technician per year for training and certification, prioritize training on your fleet's most common repair areas, and tie pay/advancement to certification levels. Impact: 20-30% improvement in technician productivity, 10-15% improvement in repair quality, 10-15% improvement in technician retention.
Fleet-Specific PM Schedules (Not Generic)
Create PM schedules tailored to your specific fleet composition, duty cycle, and climate. A suburban school bus with long highway routes has different PM needs than an urban transit bus with stop-and-go service. Generic PM schedules lead to over-maintenance in some areas and under-maintenance in others. Top fleets analyze their duty cycle (hours per day, routes, duty cycle mix) and adjust PM timing accordingly. Implementation: baseline PM schedules from OEM, modify based on your fleet's actual duty cycle and performance history (if brake failures are frequent, increase brake PM frequency; if none, hold). Document your fleet-specific PM schedule and require all technicians to follow it. Impact: 15-20% reduction in unnecessary PM work, maintained or improved reliability, better utilization of technician time on high-impact maintenance.
Warranty Claim Recovery Process
Systematically track warranty windows, document repairs with photos and diagnostics, and submit warranty claims within 30 days of repair. Top fleets recover 25-35% more in warranty value than fleets without systems, recovering $15,000-$35,000 annually per 40-bus fleet. Implementation: enter warranty dates in CMMS when vehicles are purchased, tag warranty-eligible repairs, capture photo/diagnostic documentation automatically, and generate warranty claims with BusCMMS integration. Impact: $15,000-$35,000 annual warranty recovery per 40-bus fleet, 20-30% improvement in claim approval rates, reduced maintenance cost per mile.
AI-Powered Daily Inspections (Digital DVIR)
Replace manual daily vehicle inspections with AI dashcam inspections that capture video, analyze for defects, and automatically log findings. AI inspection accuracy is 88-94% vs 68-76% for manual inspection, completing in 3-5 minutes vs 20-35 minutes. Top fleets use AI inspection 3-5 times per week plus monthly manual deep dives for compliance. Implementation: deploy multi-camera system on all buses, integrate with BusCMMS, and configure auto-alerts for high-priority defects. Impact: 25-35% improvement in defect detection, 8x faster inspection completion time, 65-70% reduction in labor cost for inspections, 35-45% reduction in accident rate.
Data-Driven Vendor Management
Evaluate and manage parts suppliers using scorecards that measure: fill rate (what % of orders are completely fulfilled), lead time accuracy (how often vendors meet promised delivery dates), quality (defect rate), warranty support responsiveness, and price accuracy. Top fleets consolidate purchasing with 95%+ rated vendors and deprioritize underperformers. Implementation: calculate vendor scorecard monthly from CMMS procurement data, review quarterly with vendors, and tie volume discounts to performance targets. Impact: 15-25% reduction in emergency parts orders, 10-15% cost reduction through vendor consolidation and volume discounts, improved parts availability due to higher-performing vendor selection.
Monthly Maintenance Reporting to Leadership
Generate executive-level maintenance reports monthly (or quarterly for leadership review) showing: fleet health scorecard (PM compliance, downtime, availability %), cost analysis (spend per mile vs budget), safety metrics, and forward-looking initiatives. Top fleets use data-driven reports to justify budget requests, demonstrate program ROI, and track improvement trends. Implementation: use CMMS reporting tools to auto-generate KPIs, add narrative context, and present to leadership with talking points. Impact: improved budget justification (easier to fund initiatives when data is clear), better board understanding of maintenance program value, data-driven decision-making on capital investments and fleet replacement timing.
Implementation Roadmap: Start Small, Scale Systematically
Implementing all 10 best practices simultaneously is overwhelming. Top fleets implement in phases over 12-24 months. Here is the recommended sequence:
Implement CMMS (if not already in place) and digital work orders. Train technicians on data entry. Establish PM compliance tracking. This creates the foundation for all other improvements. Focus: process discipline and data quality.
Implement warranty tracking and begin systematic claim submission. Deploy AI inspections on 20% of fleet as pilot. Analyze vendor performance and consolidate purchasing. Focus: early wins that generate cost savings and improve visibility.
Deploy AI inspections fleet-wide. Implement predictive maintenance on brake systems first. Begin technician training programs. Focus: shifting from reactive to proactive maintenance and improving technician capability.
Expand predictive maintenance to transmission and engine systems. Establish fleet-specific PM schedule optimization. Launch monthly maintenance reporting. Focus: data maturity and strategic optimization.
Become a Top-Quartile Fleet in 2026
Implement these 10 best practices and achieve 94%+ vehicle availability, lower maintenance cost per mile, and predictable budgets. BusCMMS supports all 10 practices with integrated tools and reporting.
Five years ago we were a below-average fleet: 82% availability, high downtime, technicians working reactively. We started implementing these best practices: digital work orders, PM compliance tracking, then predictive maintenance. Year 3 we were at 91% availability. Year 5 we're at 94%, our cost per mile dropped 18%, and we prevented 12 accidents through better brake maintenance. The superintendent now brings our maintenance program up as a model for the district. These best practices genuinely work.
FAQ: Implementing Maintenance Best Practices
Which best practice should I implement first?
How long does it take to implement all 10 practices?
What is the cost to implement these practices?
Can small fleets (10-20 buses) benefit from these practices?
How do I measure whether I'm making progress?
What if my fleet has very different vehicle types (school bus + paratransit van)?
How do I keep technicians engaged during implementation?
Is there a tool that supports all 10 practices?
Conclusion: Excellence Is Systematic, Not Accidental
The best-in-class bus fleets are not lucky -- they are systematic. Top-quartile performance in vehicle availability, maintenance cost, and safety comes from disciplined execution of maintenance best practices applied consistently over months and years. A fleet that implements even 5 of these practices will measurably improve performance within 12 months. A fleet that implements all 10 becomes a top-quartile operation. Start your free BusCMMS trial to begin implementing these best practices with integrated tools. Or schedule a demo to discuss which practices fit your fleet's priorities and create an implementation roadmap.