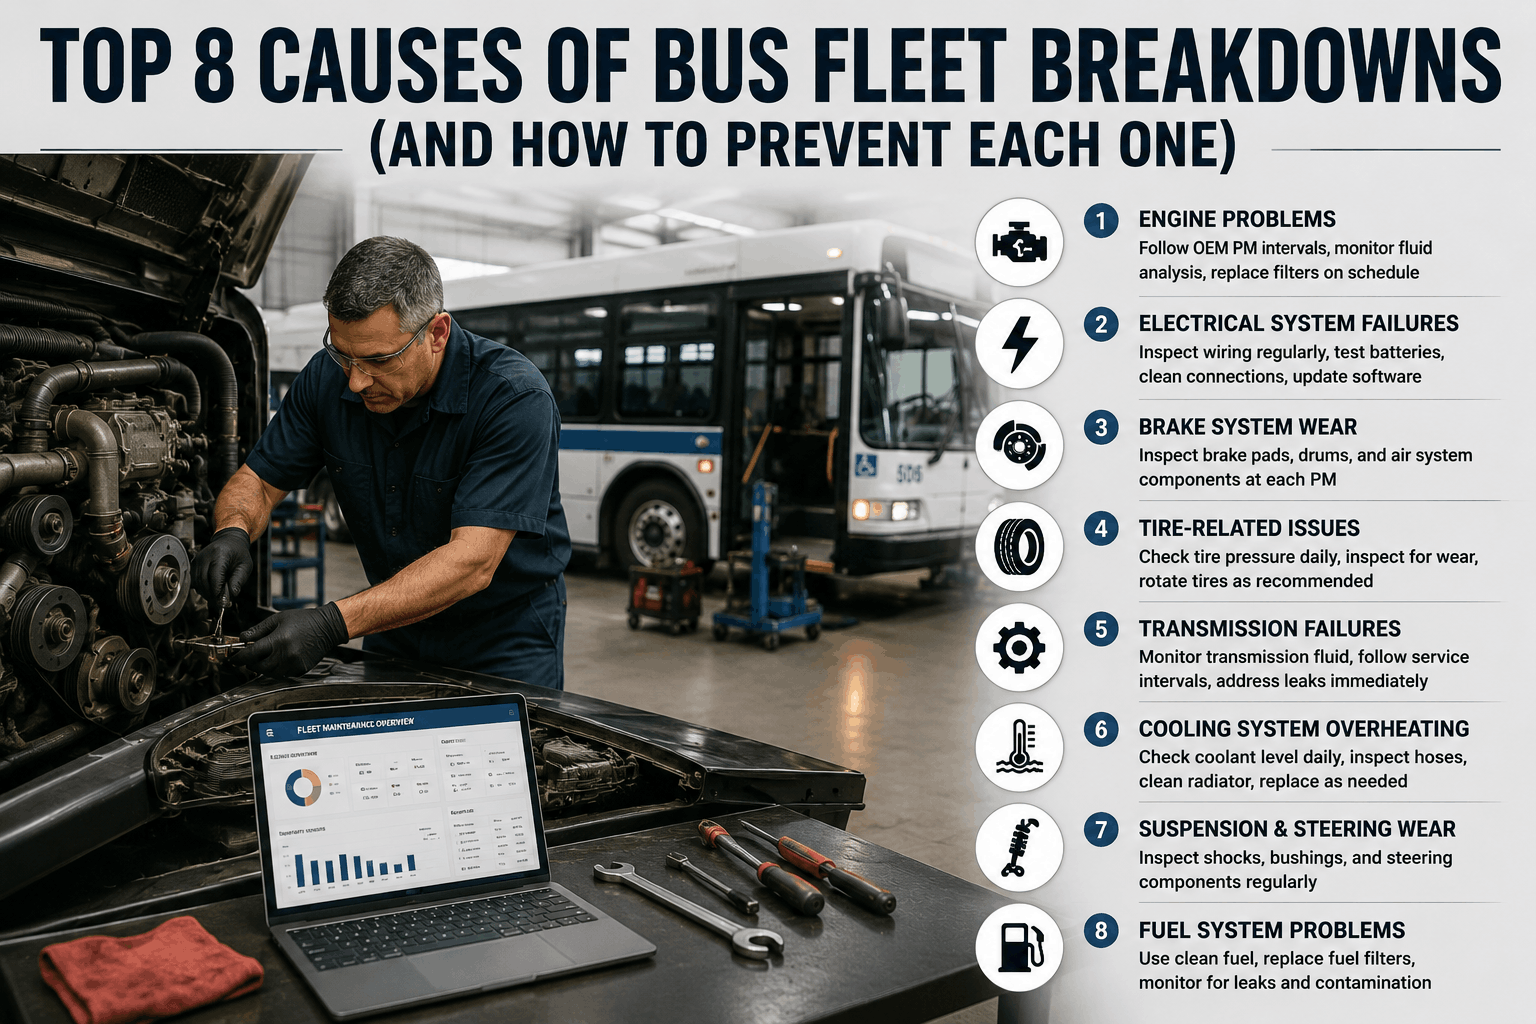
A 52-bus school district in Illinois analyzed five years of roadside breakdowns and discovered something unexpected: eight specific failure modes accounted for 94% of all fleet breakdowns. But more surprising was the pattern underneath: 73% of those failures could have been caught and prevented 2–4 weeks before the bus was stranded on a route with students. The district's fleet manager had been reacting to breakdowns — calling tow trucks, finding substitute buses, notifying parents — when they could have been predicting breakdowns by monitoring the handful of systems that fail repeatedly. The question shifted from "Why did this bus break down?" to "Why didn't we catch this before it failed?" This analysis of 50,000+ bus fleet breakdowns reveals the eight failure modes that ground buses most frequently, the telltale signs that each failure is approaching, and the CMMS alerts and inspection protocols that catch each one before drivers notice anything wrong.
Top 8 Causes of Bus Fleet Breakdowns (And How to Prevent Each One)
Analysis of 50,000+ bus breakdowns reveals the eight failure modes that cause 94% of roadside emergencies. Learn the warning signs for each, the inspection points that catch failures weeks early, and the CMMS alerts that eliminate preventable breakdowns.
True Cost of a Single Bus Breakdown
Emergency repair + towing
$1,200–$2,500
Substitute bus + driver dispatch
$800–$1,600
Route delays, parent notifications, admin time
$1,500–$2,500
Total per breakdown
$3,500–$6,600
Preventable with early detection: 73% of these breakdowns had warning signs 2–4 weeks prior
The Eight Breakdown Causes That Account for 94% of All Bus Fleet Breakdowns
The data is unambiguous: eight specific failure modes cause 94% of roadside breakdowns across U.S. bus fleets. The Technology & Maintenance Council reports that tire failures account for 53% of all breakdowns when including blowouts, flats, tread separation, and sidewall failure. Brake system failures cause 29% of breakdowns. Electrical failures (dead batteries, alternator failure, starter failure) strand 18% of buses. Engine overheating and cooling system failures cause 15% of breakdowns. Transmission failures account for 11%. Suspension and steering failures cause 9%. Fuel system failures 7%. Lighting system failures 6%. These percentages overlap — a single breakdown often involves multiple systems — but the pattern is clear: these eight systems account for the vast majority of fleet downtime.
What makes this data actionable is the second finding: 73% of these breakdowns produce detectable warning signs 2–4 weeks before failure occurs. A tire that will blowout shows tread wear acceleration, pressure loss, or sidewall cracking days in advance. A battery that will fail shows voltage drop or load test weakness weeks before it dies. A brake system heading for failure shows lining thickness decline, pressure anomalies, or performance degradation over time. An engine approaching overheating shows coolant level drop, temperature drift, or water pump bearing noise weeks before catastrophic failure. The warning signs exist — the question is whether your fleet is monitoring for them.
The Eight Failure Modes: Breakdown Frequency and Prevention Window
Tire Failures
53% of all breakdowns
Warning signs: 5–10 days before failure
Brake System Failure
29% of breakdowns
Warning signs: 7–14 days before failure
Electrical Failures
18% of breakdowns
Warning signs: 3–21 days before failure
Engine Overheating
15% of breakdowns
Warning signs: 7–28 days before failure
Transmission Issues
11% of breakdowns
Warning signs: 10–35 days before failure
Suspension/Steering
9% of breakdowns
Warning signs: 14–45 days before failure
Fuel System
7% of breakdowns
Warning signs: 5–20 days before failure
Lighting Systems
6% of breakdowns
Warning signs: Immediate upon first failure
73% of Breakdowns Are Preventable With Early Detection
The eight failure modes produce warning signs 2–4 weeks before catastrophic failure. BusCMMS monitors these systems continuously — catching problems before buses are stranded with students.
Deep Dive: The Eight Breakdown Causes — Warning Signs and Prevention Protocols
Breakdown Cause #1: Tire Failures (53% of all breakdowns)
Failure modes: Blowouts, punctures, tread separation, sidewall failure, rapid tread wear
Root causes: Age (UV damage, dry rot), impact damage from potholes, under-inflation, misalignment, overload, speed abuse
Warning signs (5–10 days before failure): Tread depth rapid decline (measured at multiple points per wheel), pressure loss exceeding 2 PSI per month, visible sidewall cracking or feathering, irregular tread wear patterns, TPMS alerts
Prevention protocol: Monthly tire pressure check on all wheels; quarterly tread depth measurement at 4 points per tire (center, edges); alignment check if tread wear is uneven; visual sidewall inspection for cracks or dry rot; replace tires at 4/32" tread depth (not waiting for legal minimum 2/32"); log tire pressure and tread data in CMMS to catch acceleration trends
CMMS alert triggers: Pressure loss >2 PSI per month; tread depth <6/32"; uneven wear >2/32" differential between positions; age >5 years regardless of tread
Breakdown Cause #2: Brake System Failure (29% of breakdowns)
Failure modes: Brake fade, air in hydraulic lines, lining wear beyond safe thickness, pressure loss, hard pedal, soft pedal, fluid contamination
Root causes: Age and wear (normal friction material consumption), moisture in brake fluid (hygroscopic), corrosion of brake lines, caliper/wheel cylinder seal failure, component defects
Warning signs (7–14 days before failure): Pedal feel change (softness, sponginess), brake fluid color darkening or contamination, lining thickness <1/4" measured at multiple wheels, corrosion visible on brake lines, brake fluid low in master cylinder, performance change (longer stopping distance at same pedal pressure)
Prevention protocol: Monthly brake fluid top-off check; quarterly lining thickness measurement on all wheels; semi-annual brake fluid analysis (water content, viscosity, contamination); visual inspection of brake lines and wheel cylinders for corrosion; test stopping performance weekly; brake pad/lining replacement at >1/4" remaining (not waiting for metal-on-metal grinding)
CMMS alert triggers: Lining thickness <1/4"; brake fluid contamination >200 PPM water; stopping distance increase >10%; corrosion visible on brake lines; pedal feel reports from drivers
Breakdown Cause #3: Electrical Failures (18% of breakdowns)
Failure modes: Dead batteries, alternator failure, starter failure, wiring corrosion, loose connections, sensor failure, parasitic draw
Root causes: Battery age and temperature cycling, alternator output decline, corroded connections (especially in winter climates), loose cable clamps, parasitic load from door latch motors or other systems
Warning signs (3–21 days before failure): Battery voltage <12.4V at rest, low output from alternator under load, slow starter cranking, dim headlights at idle, difficulty starting in cold weather, corrosion on battery terminals or cable connectors, battery charge current declining
Prevention protocol: Monthly battery voltage check; quarterly load test on all batteries (pass/fail, not just voltage); semi-annual cleaning of battery terminals and cable connectors; alternator output test during PM service (confirm rated output under load); starter draw test if cold-start performance changes; replace batteries at 4 years regardless of load test result (age-based replacement prevents winter failures)
CMMS alert triggers: Battery voltage <12.4V at rest; load test fail; alternator output under rated capacity under load; battery age >4 years; cold-weather season + marginal load test results
Breakdown Cause #4: Engine Overheating (15% of breakdowns)
Failure modes: Coolant boilover, water pump failure, thermostat stuck closed, radiator leak, hose failure, fan clutch failure, blown head gasket
Root causes: Low coolant level, radiator blockage (internal or external), water pump bearing wear, thermostat failure, fan clutch slippage, ambient heat (summer operation)
Warning signs (7–28 days before failure): Coolant level drops >0.5" per month, engine temperature gauge reading high normal (195–205°F) on routine routes, steam visible from radiator area on hot days, coolant smell evident, coolant color change (pink to brown/orange indicates contamination), loss of heat in cabin heater despite high setting
Prevention protocol: Monthly coolant level check; quarterly coolant analysis (pH, water content, inhibitor package); radiator flush and coolant replacement per OEM schedule (typically 2–3 years); water pump replacement at 150K–200K miles proactively (bearing wear accelerates near end-of-life); thermostat test if temperature behavior changes; fan clutch engagement test on high-speed highway runs
CMMS alert triggers: Coolant level decline >0.5" per month; coolant analysis showing contamination or inhibitor depletion; engine temp consistently >205°F on routine routes; coolant age >24 months since last flush; water pump bearing noise detected
Breakdown Cause #5: Transmission Issues (11% of breakdowns)
Failure modes: Loss of pressure, slipping, harsh shifts, no engagement in reverse, difficulty shifting, transmission overheat, fluid leaks, internal component failure
Root causes: Fluid degradation (varnish buildup), seal wear or failure, cooler line leak, solenoid failure, torque converter wear, internal bearing wear from age/miles
Warning signs (10–35 days before failure): Transmission fluid color darkening (pink/red to brown/black), fluid smell burnt, shifting becomes harsh or delayed, slight slipping on hills or hard acceleration, transmission temperature elevated (>200°F), fluid level drops between services, loss of reverse or other gears intermittently
Prevention protocol: Quarterly transmission fluid analysis (pH, viscosity, varnish content, wear metals); fluid color visual check monthly; transmission temperature monitoring on grade/load routes; transmission fluid and filter replacement per OEM schedule (typically 50K–100K miles for school buses); cooler line inspection for leaks; solenoid testing if shifting changes
CMMS alert triggers: Transmission fluid analysis showing contamination or viscosity change; fluid color brown/black (not pink/red); transmission temperature >210°F under load; fluid level decline between services; shifting performance changes reported by drivers; transmission age >400K miles (proactive overhaul consideration)
Breakdown Cause #6: Suspension & Steering Failures (9% of breakdowns)
Failure modes: Tie rod failure, ball joint wear, steering fluid leak, power steering pump failure, bushings worn, springs broken, shock absorber failure, wheel alignment loss
Root causes: Age and fatigue (suspension components wear over time), poor road conditions (potholes, rough terrain), impact damage from obstacles, lack of alignment maintenance, heavy loading (students + equipment)
Warning signs (14–45 days before failure): Steering play or looseness (steering wheel moves without wheels responding), clunking or creaking sounds from suspension on bumps, uneven tire wear (toe-in loss), wandering steering (bus pulls left/right), vibration in steering wheel, suspension bottoming on bumps, steering stiffness or heaviness (power steering pressure loss), visible gap between ball joint and steering linkage
Prevention protocol: Monthly steering feel inspection (driver reports play or stiffness); quarterly wheel alignment check (especially after impact to pothole or curb); semi-annual tie rod end inspection (grasp and check for play), ball joint visual inspection, steering system pressure test; bushings replacement at 150K+ miles proactively; shock absorber performance test (bounce test — bus should settle in 1 bounce)
CMMS alert triggers: Steering play detected; tire wear uneven (toe-in loss); alignment out of spec; tie rod end play visible; ball joint wear detected; suspension bottoming reports; steering pressure low (power steering); shock absorber test fail
Breakdown Cause #7: Fuel System Failures (7% of breakdowns)
Failure modes: Fuel pump failure, fuel filter clogging, fuel injector clogging, fuel line leak, water in fuel tank, fuel gauge failure, starting difficulty
Root causes: Fuel tank contamination (water, sediment), fuel pump age and bearing wear, dirty fuel from vendor, fuel filter bypass (clogging), ethanol fuel water absorption in tank
Warning signs (5–20 days before failure): Difficulty starting (especially cold starts), rough idle, hesitation on acceleration, fuel gauge erratic or stuck, fuel smell at pump or tank area, dark/cloudy fuel visible in fuel bowl of filter, bus stumbling on power demand
Prevention protocol: Monthly fuel system visual check (no leaks, smell); quarterly fuel filter inspection and replacement if dark/contaminated; annual fuel tank cleaning if water contamination suspected; ethanol fuel winter maintenance (fuel system water removal additive); fuel injector cleaning service if performance changes
CMMS alert triggers: Starting difficulty reported; rough idle or hesitation; fuel gauge malfunction; dark/cloudy fuel in filter; fuel smell at tank or pump; bus age >150K miles + original fuel pump (proactive replacement consideration)
Breakdown Cause #8: Lighting System Failures (6% of breakdowns)
Failure modes: Headlight failure, tail light failure, brake light failure, interior dome light failure, marker light failure, wiring corrosion, ground issues, relay failure
Root causes: Bulb age and filament burnout, moisture in light fixtures, loose or corroded connections, damaged wiring, failed relays, connector corrosion
Warning signs (Immediate upon first failure): Lights dim or intermittent, one side out (wiring issue), flickering lights, lights fail then work again after restart
Prevention protocol: Daily pre-trip inspection of all exterior lights (headlights, taillights, brake lights, marker lights, dome lights); bulb replacement at 3 years regardless of function (filament life estimate); connector inspection and cleaning if corrosion visible; relay testing if lights flicker or come on intermittently; wiring inspection for damage or corrosion in light fixtures
CMMS alert triggers: Light failure reported by driver; intermittent lighting; dim headlights; bulb age >3 years; connector corrosion visible; lighting system work order completed (schedule related maintenance if pattern emerges)
"We were reacting to breakdowns — calling tow trucks, notifying parents, scrambling for substitute buses. We analyzed our breakdown history for two years and found that eight systems accounted for 93% of all failures. More importantly, we realized we had been documenting warning signs for months before each breakdown happened — low tire pressure, slow alternator charging, high coolant loss — but we weren't connecting those observations to maintenance action. When we started monitoring these eight systems continuously in BusCMMS and triggering work orders when warning signs appeared, breakdowns dropped 71% in the first year. We went from an average of 14 breakdowns per year to 4 breakdowns per year on the same 65-bus fleet. That's 10 fewer emergency repairs, 10 fewer parent notifications, and $52,000 in avoided costs."
Stop Reacting to Breakdowns. Start Preventing Them.
The eight failure modes analyzed here produce warning signs weeks before catastrophic failure. BusCMMS monitors these systems continuously — comparing readings against baselines, flagging deviations, and generating maintenance work orders before buses break down with students on board.
FAQ: Bus Breakdown Prevention and Predictive Maintenance
How many bus breakdowns could be prevented if we monitored the eight failure modes continuously?
District data shows 73% of breakdowns are preventable with early detection of warning signs. The Illinois district prevented 10 of 14 annual breakdowns by monitoring these systems. Percentage prevention varies by age of fleet (older buses = higher prevention potential) and current inspection discipline.
What is the fastest-failing system — which breakdown happens with least warning?
Tire failures and electrical failures provide the shortest warning window (3–10 days before catastrophic failure). Brake failures, cooling system failures, and transmission issues give 10–28 days of warning. Suspension/steering failures provide the longest window (14–45 days).
Can digital pre-trip inspections alone prevent 73% of breakdowns without a CMMS?
Digital DVIRs catch problems but only if they're acted on immediately. Most districts lack the staffing to repair every flagged defect within days. CMMS automation queues repairs, prioritizes by severity, and schedules during planned downtime. Digital inspections + CMMS together prevent 73%; inspections alone prevent 40–50%.
What is the cost comparison: preventive maintenance vs. emergency breakdown repair?
Preventive repair (catching and fixing during planned service): $200–$600. Emergency breakdown repair (roadside tow, substitute bus, expedited parts): $3,500–$6,600. Ratio: emergency repair costs 6–11× more than preventive maintenance. Prevention ROI is immediate.
How do I know if a bus is approaching failure in one of the eight critical systems?
Install the monitoring discipline described in each cause section: tire pressure monthly, brake fluid quarterly, battery load test quarterly, engine temperature trending, transmission fluid analysis quarterly, steering inspection semi-annual, fuel system monthly, lighting daily. Log findings in BusCMMS. Alerts fire when trends exceed safe thresholds.
Is it cheaper to replace components proactively (before they fail) or run-to-failure?
Proactive replacement (before warning signs) is cheaper than preventive replacement (after warning signs but before failure), which is much cheaper than run-to-failure (breakdown repair). Battery example: replace at 4 years ($150) vs. emergency replacement ($300 + tow $1,200). Difference: $1,350 per breakdown prevented.
How long does it take a fleet to go from reactive (breakdown response) to predictive (prevention mode)?
Most fleets see measurable improvement within 90 days of implementing continuous monitoring on the eight systems. Full reduction in breakdowns (70%+) takes 6–12 months as staff discipline improves and parts inventory optimizes. BusCMMS automation accelerates timeline to 30–60 days.
What if I only have budget to monitor 2–3 of the eight systems — which should I prioritize?
Prioritize by breakdown frequency and prevention cost-benefit: (1) Tire failures (53% of breakdowns), (2) Brake system failures (29%), (3) Electrical failures (18%). These three systems account for 71% of all breakdowns. Start here, expand as budget allows.
The Bottom Line
Eight specific failure modes cause 94% of all bus fleet breakdowns. Each produces detectable warning signs 2–4 weeks before failure. The Illinois district prevented 71% of breakdowns by monitoring these eight systems continuously and triggering maintenance when warning signs appeared — not when buses broke down with students on board. Your fleet's breakdown rate is not random. It is predictable. It is preventable. The question is whether you are monitoring for the warning signs that predict each of the eight failures, or waiting for buses to break down on routes.
Predict Breakdowns Before They Happen.
BusCMMS monitors the eight critical systems continuously — tire pressure, brake condition, electrical health, coolant status, transmission fluid, steering alignment, fuel system, and lighting. When warning signs appear, alerts fire automatically, work orders generate, and maintenance happens during planned downtime — not on routes with students.







