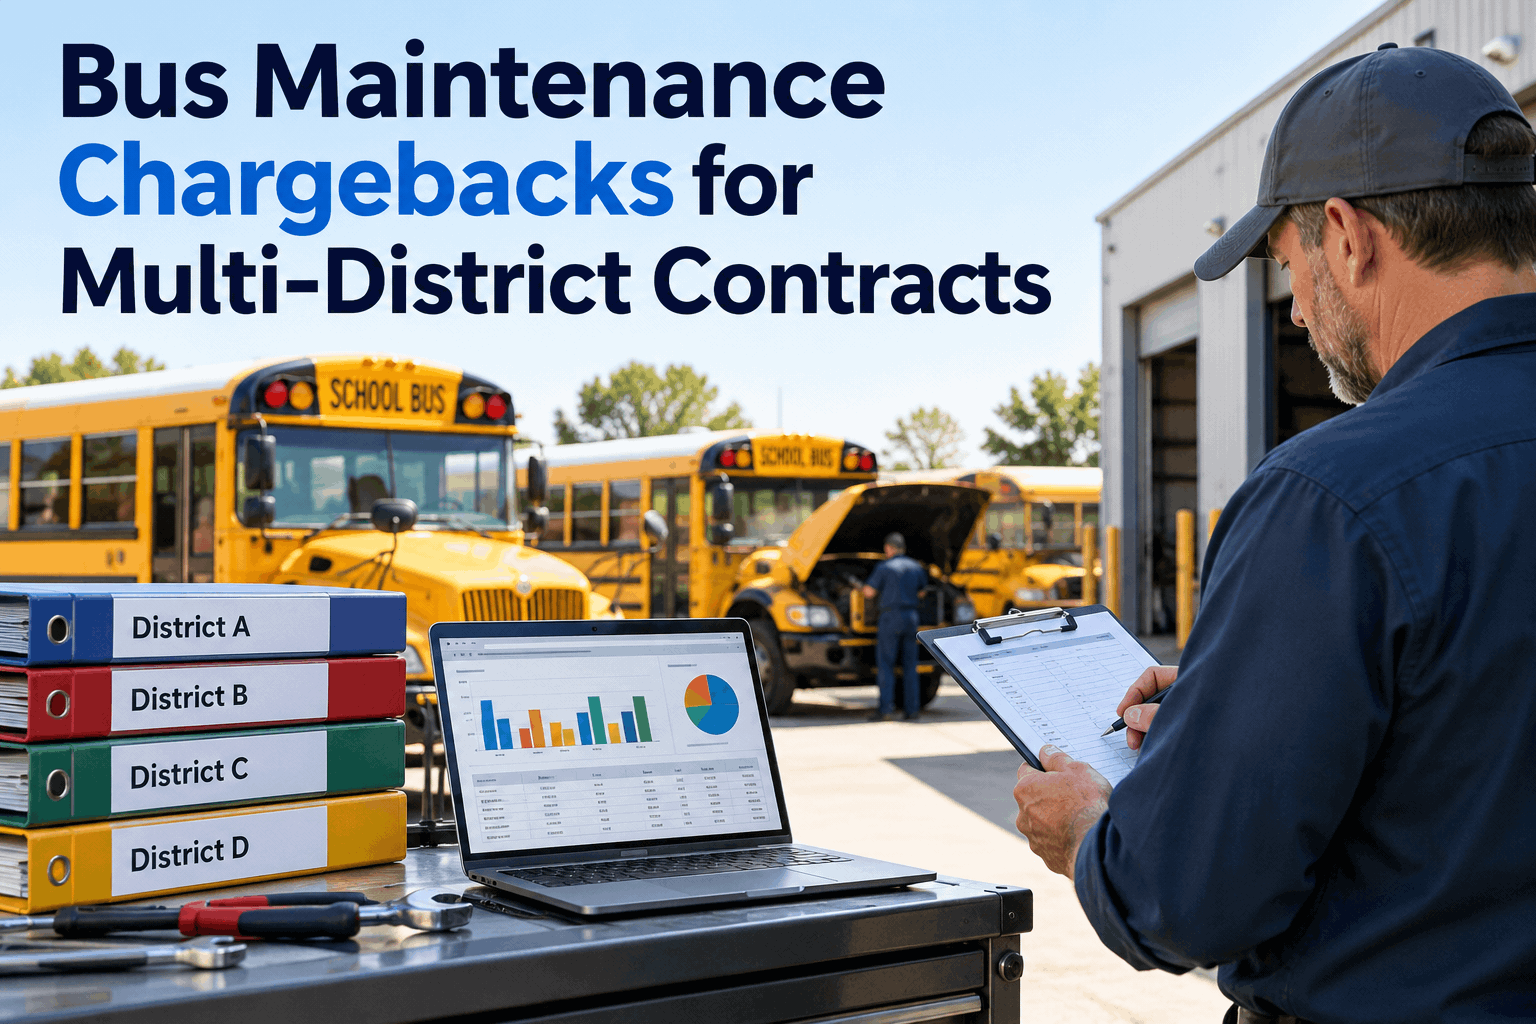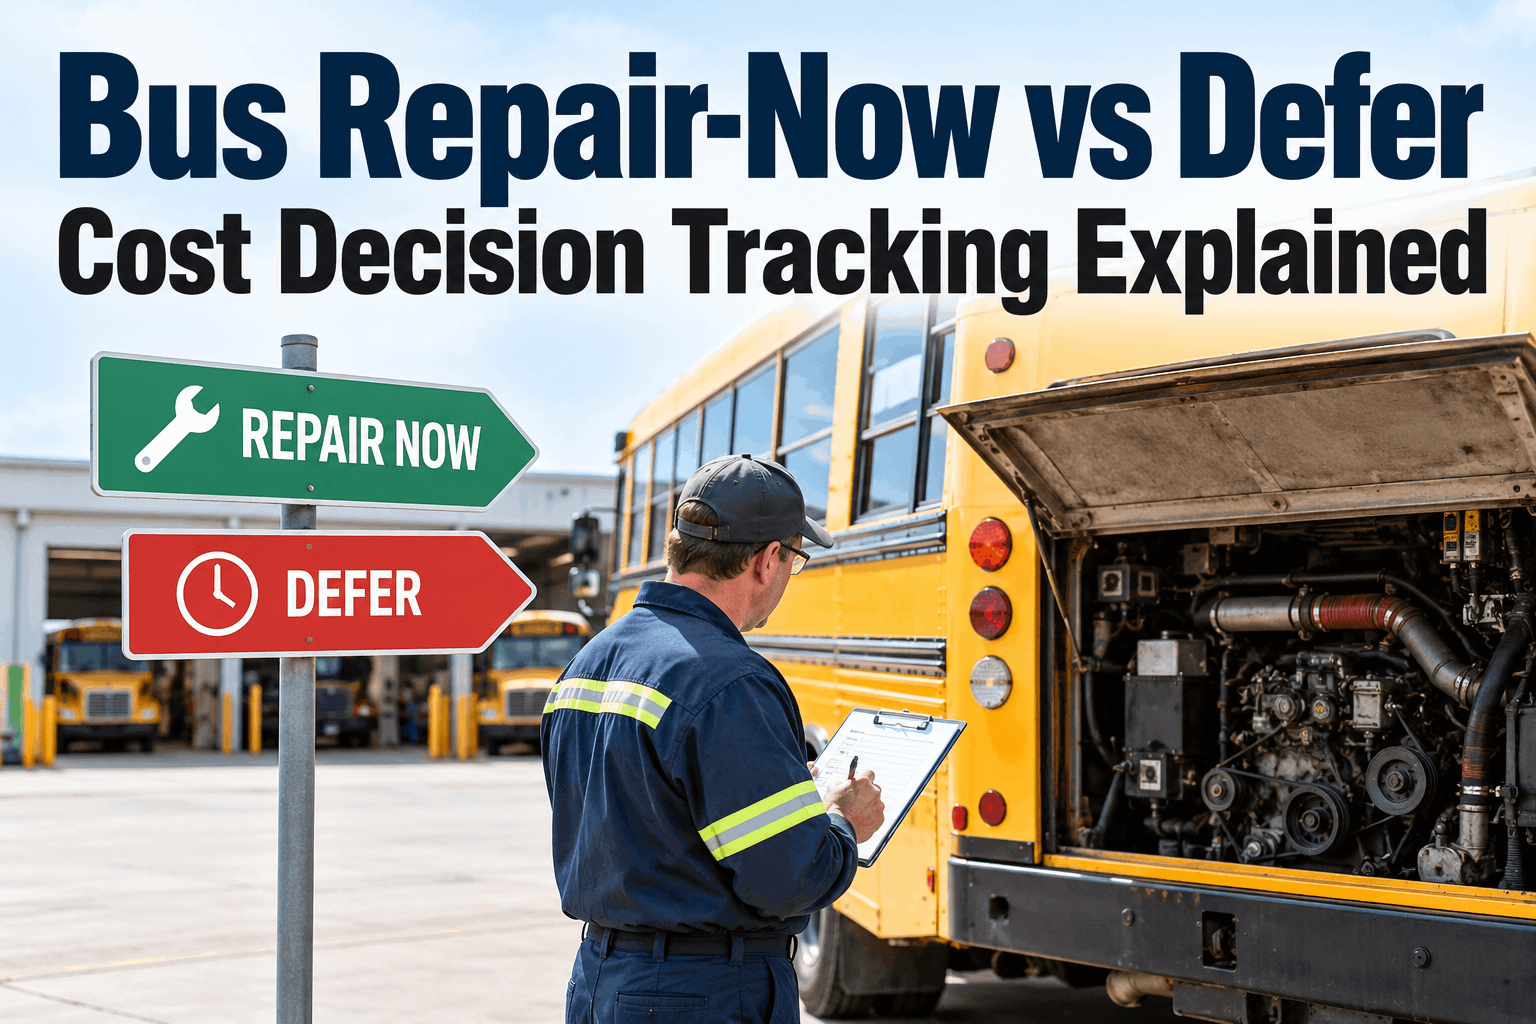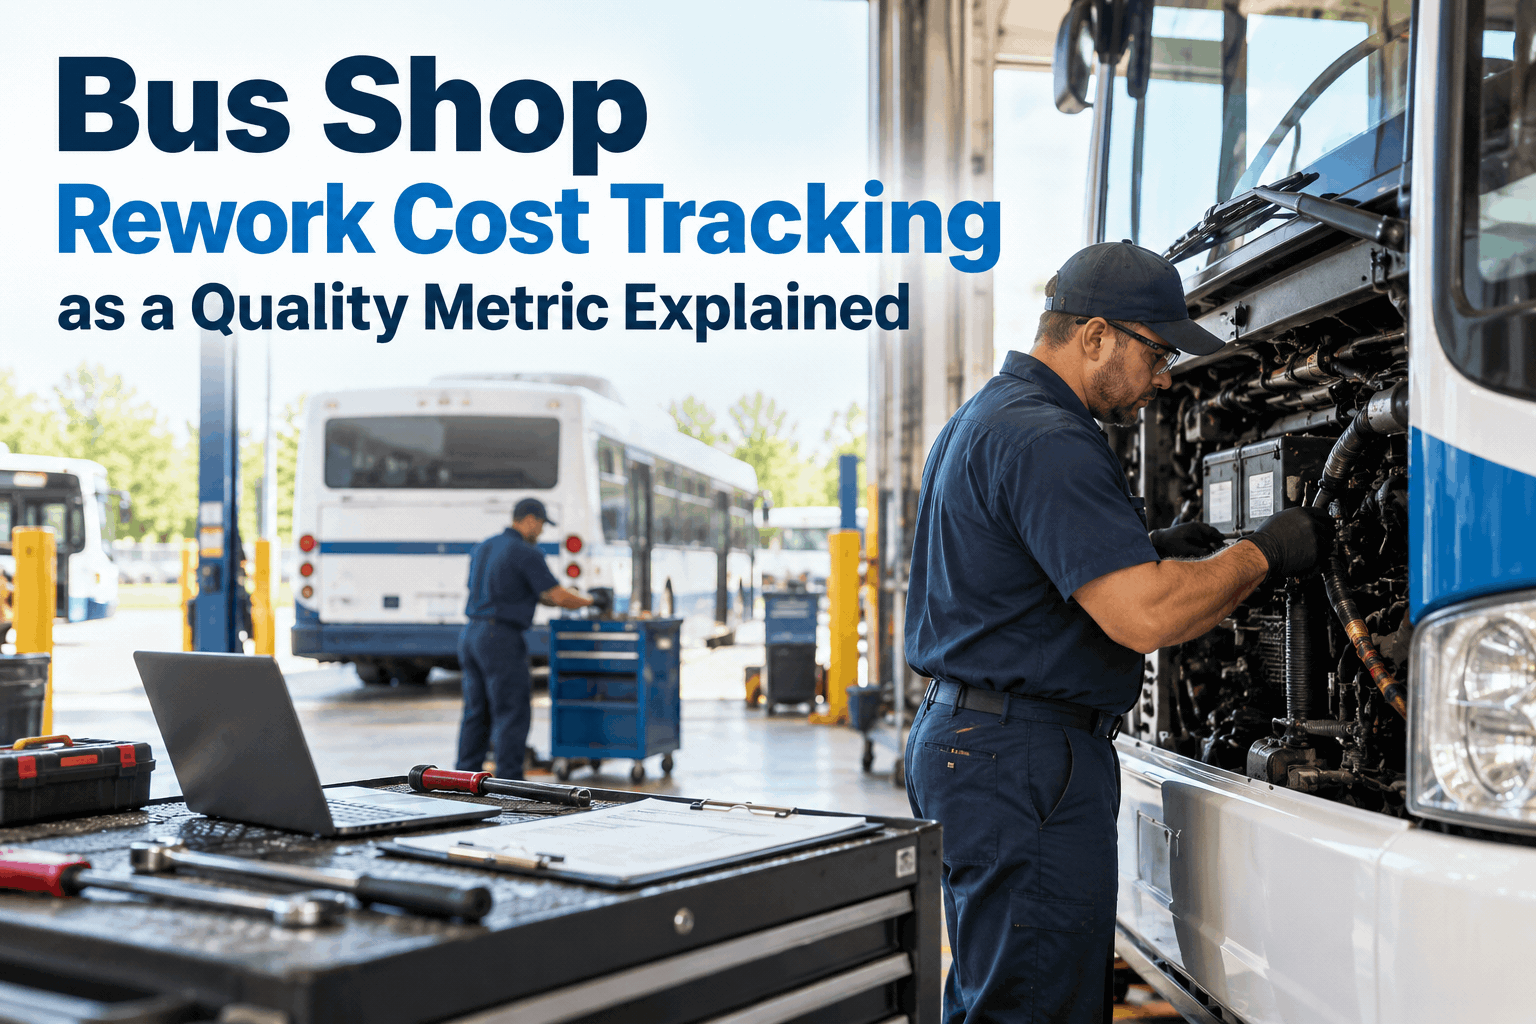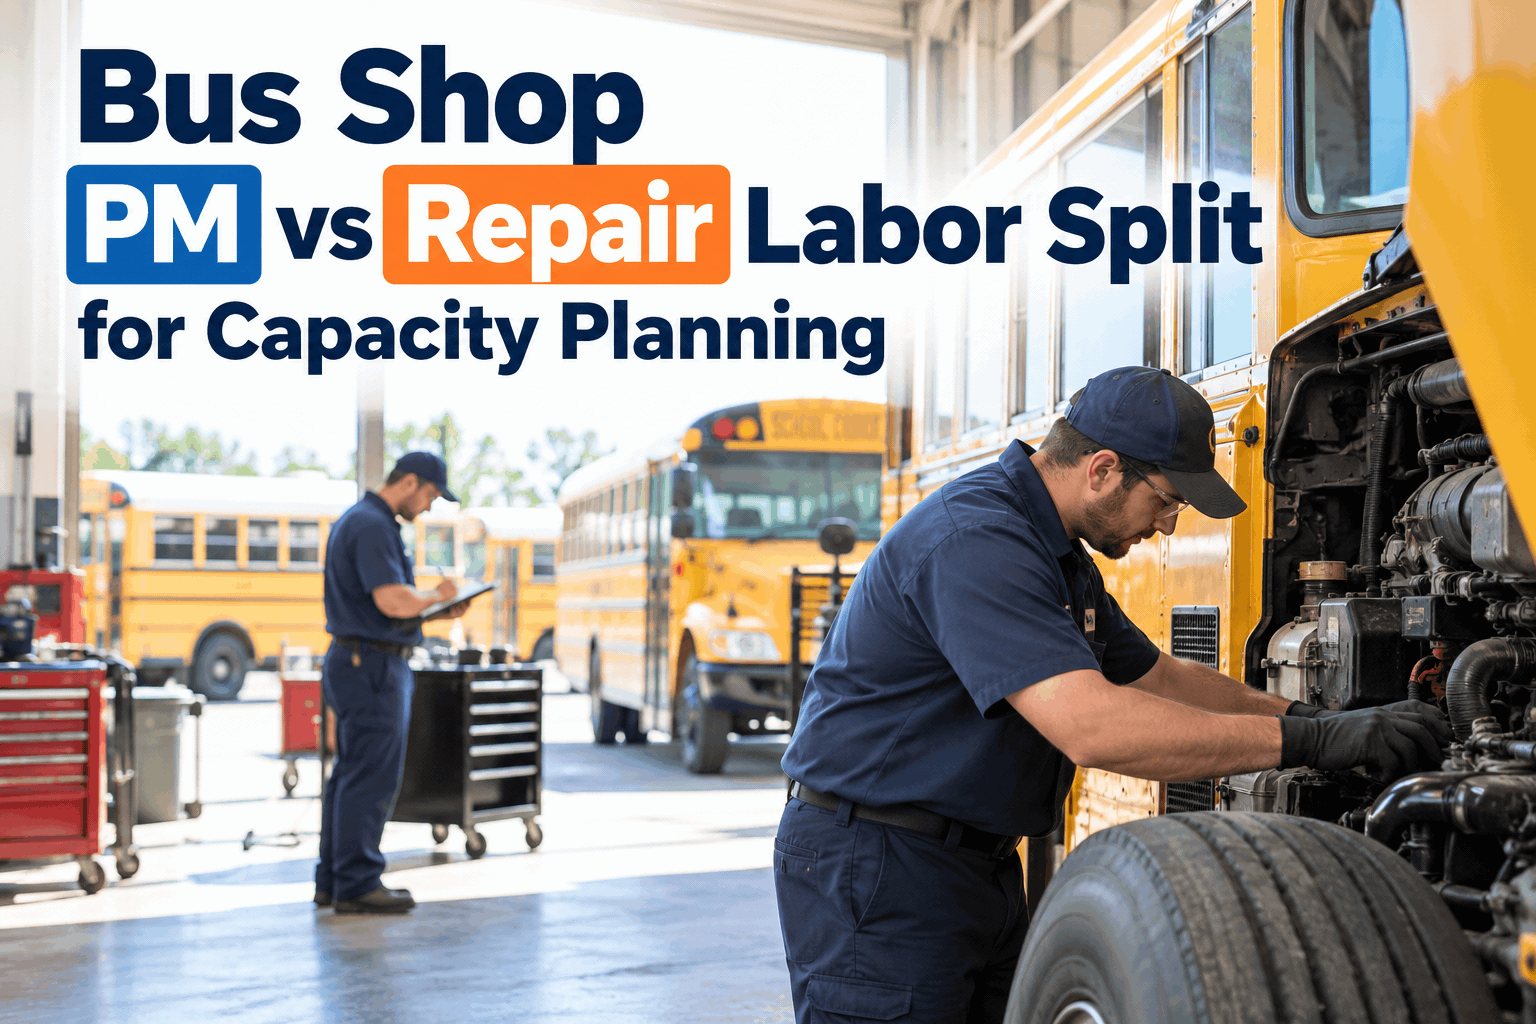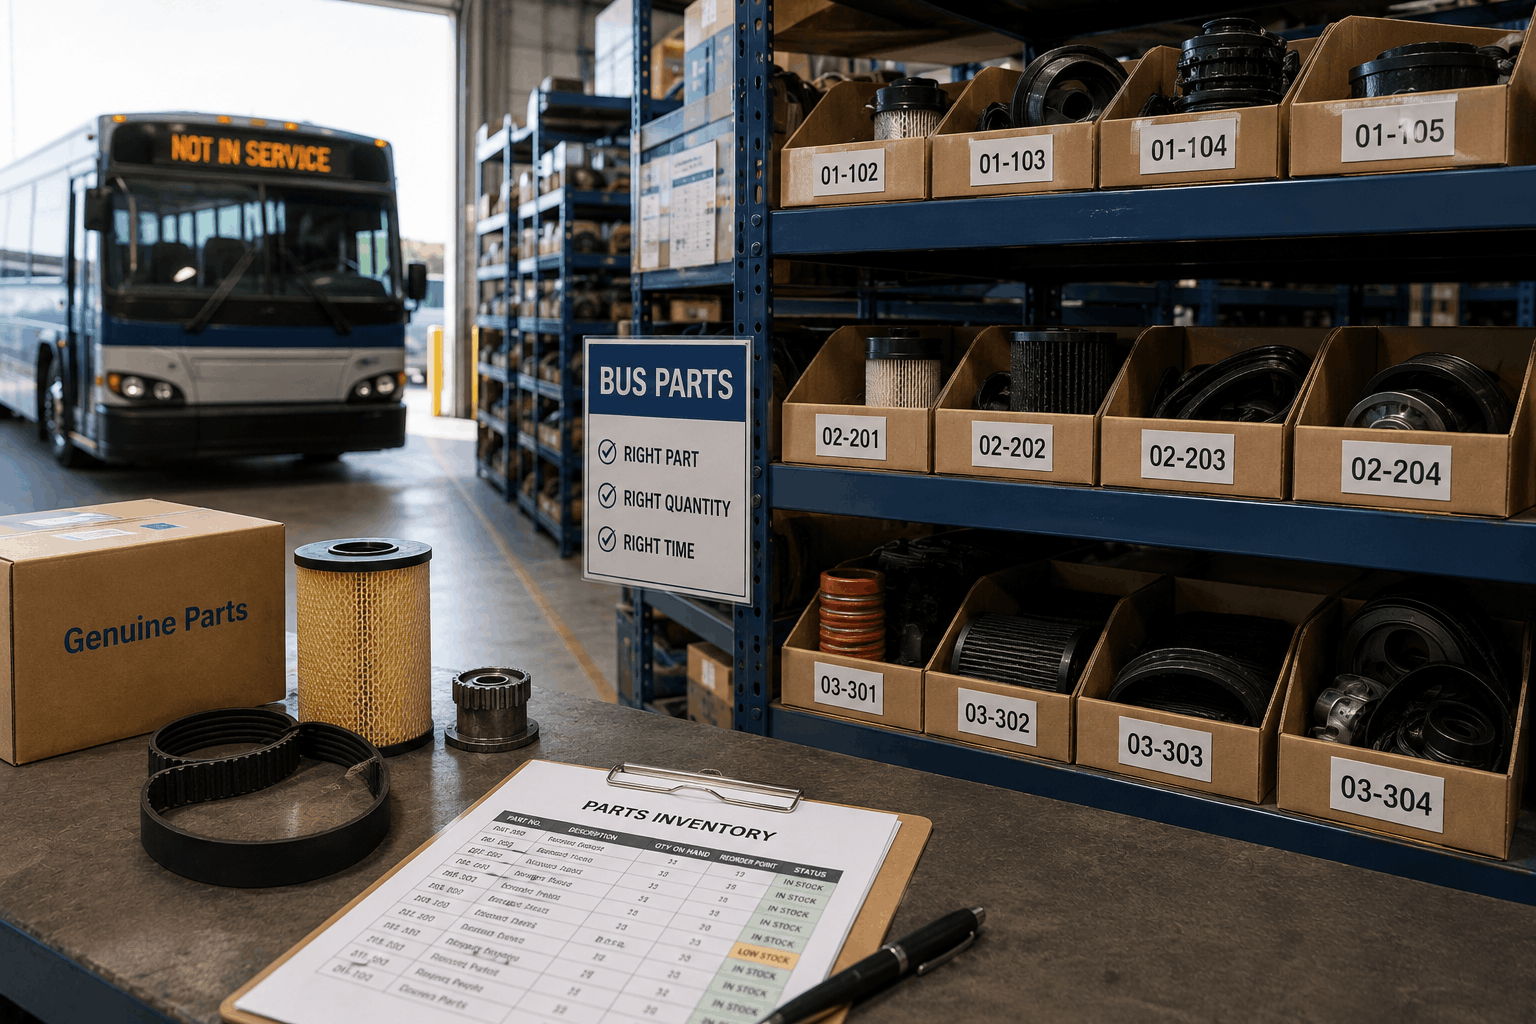
Bus fleet maintenance depends on parts availability. When a critical component fails—an air brake valve, an alternator, a transmission solenoid—the bus is out of service until the replacement part arrives. If the part is in stock, the bus is back on the road in hours. If the part must be ordered, the bus might sit idle for days or weeks, generating no revenue while maintenance costs accumulate. Parts inventory management is therefore not just about stock levels—it's about operational uptime, maintenance cost control, and avoiding the cascade of problems that result from keeping buses off the road. Most transit agencies and commercial fleets manage parts inventory using spreadsheets, manual counting, and reactive ordering. A mechanic notices a part is running low, submits a purchase order, and hopes it arrives before the next failure occurs. This reactive approach is expensive: emergency procurement costs 30-50% more than planned procurement. Parts expire or become obsolete while sitting on shelves. Critical parts are backordered while slow-moving inventory accumulates dust. A systematic approach to parts inventory management—using demand forecasting, reorder point analysis, and CMMS-based tracking—reduces emergency procurement costs by 40-50%, cuts inventory carrying costs by 25-35%, and improves fleet uptime by 15-20%. Here's how leading transit agencies manage parts inventory effectively.
Transit Bus Parts Inventory Management
Best practices for bus fleet parts inventory management. Learn how leading transit agencies use CMMS to forecast demand, set reorder points, and cut emergency procurement costs by 45%.
Understanding Parts Consumption Patterns in Transit Fleets
Every transit fleet has unique parts consumption patterns based on fleet composition, route profiles, driver behavior, maintenance practices, and vehicle age. A fleet running primarily city routes with frequent stops will consume brakes, steering components, and suspension parts at higher rates than a fleet running primarily highway routes. A fleet with 15-year-old buses will consume more engine and transmission parts than a fleet with 5-year-old buses. A fleet operating in cold climates will experience higher wear on electrical systems and batteries than a fleet in temperate climates.
Historical consumption analysis foundation: Understanding your unique consumption patterns requires analyzing at least 2-3 years of historical maintenance data. What parts are you actually replacing? How frequently? At what mileage intervals? Are certain parts failing prematurely due to quality issues, installation problems, or excessive loading? Are certain parts lasting longer than expected, suggesting they could be replaced at longer intervals? This historical analysis creates the baseline for all future inventory decisions. Many fleets skip this step and use industry-standard part replacement rates, which may not match their operational reality. A fleet that drives 100,000 miles per year in urban congestion will replace brake pads every 12-15 months. A fleet that drives the same 100,000 miles on highways will replace brake pads every 18-24 months. Using industry averages instead of your actual data will result in either overstocking (slow-moving inventory) or understocking (emergency orders).
Seasonal and operational variation: Most transit fleets experience seasonal variation in parts consumption. Winter months typically see increased brake and electrical system repairs due to cold-start failures and freeze damage. Summer months see increased cooling system and tire failures due to heat stress. Schools and universities experience distinct seasonal peaks—high utilization and high failure rates during school year, minimal utilization and minimal failures during summer break. Your parts inventory should reflect these seasonal patterns. Carrying less stock of winter-specific parts (tire chains, battery warmers, heating element replacements) during summer makes economic sense. Building inventory before winter peak utilization prevents emergency procurement at peak pricing.
Fleet composition and parts diversity: If your fleet includes multiple bus models from different manufacturers, you face significant parts complexity. A Cummins-powered bus requires completely different engine parts than a Duramax-powered bus. An Allison transmission uses different transmission parts than a ZF automatic. An air brake system uses different components than a hydraulic brake system. Many fleets attempt to minimize this complexity by standardizing on one manufacturer and model, which significantly simplifies parts inventory management. If your fleet is diverse, you need sophisticated CMMS inventory tracking that maps each part to specific bus models and prevents ordering incorrect parts that won't fit different models.
Demand Forecasting: Predicting Parts Needs Before Failures Occur
Demand forecasting is the practice of predicting future parts requirements based on historical consumption data, current fleet status, and planned maintenance activities. Instead of waiting for a part to fail and then ordering it (reactive), you forecast future demand and place orders in advance (proactive). This allows you to purchase parts at normal pricing, receive deliveries on your schedule, and have the part in stock before the failure occurs.
Consumption rate calculation: Start by calculating consumption rates for critical parts. If your fleet of 60 buses has replaced 45 sets of brake pads over the past 24 months, your consumption rate is 45 sets per 24 months, or 1.875 sets per month, or approximately 22.5 sets per year. If you maintain 2 months of stock, you should have 3-4 sets on hand at all times (2 months × 1.875 per month). When inventory drops to your reorder point (let's say 2 sets), you automatically place an order for enough stock to bring you back to your target level (let's say 4 sets). This ensures you're never caught without stock but also prevents overstocking.
Lead time incorporation: Demand forecasting must account for supplier lead time—the time between ordering and receiving parts. If your usual supplier takes 2 weeks to deliver brake pads, and you consume 2 sets per month (0.5 sets per week), you need to maintain enough inventory to cover 2 weeks of consumption while waiting for delivery. That's 1 set of pads. So your reorder point might be 1.5 sets (covering lead time with a small safety margin), and you order when inventory drops to 1.5, requesting delivery of enough stock to reach your target level of 4 sets.
Mileage-based forecasting: For parts with predictable replacement intervals based on mileage, you can forecast demand based on projected fleet mileage. If your buses are scheduled to accumulate 500,000 fleet miles in the next quarter, and transmission oil changes are performed every 25,000 miles per bus, you'll need 20 transmission oil change kits during the quarter. You can order these in advance, ensuring availability without rush charges.
Maintenance schedule-based forecasting: Your CMMS should generate a forward-looking maintenance schedule showing which buses are due for which services in the coming weeks and months. A 12-week forward maintenance schedule shows exactly which parts will be needed: how many oil change kits, how many air filter sets, how many coolant flushes, etc. You can purchase these parts proactively based on the schedule rather than reactively based on failures.
Reorder Point Analysis: Setting the Right Stock Levels
Reorder point analysis determines the inventory level at which you should automatically place an order for more stock. Set the reorder point too low, and you risk stockouts before the new inventory arrives. Set it too high, and you're carrying excessive inventory that ties up cash and risks obsolescence. The optimal reorder point balances these risks.
Reorder point formula: The basic formula is: Reorder Point = (Average Daily Consumption × Lead Time in Days) + Safety Stock. For example, if you consume 0.5 brake pad sets per day on average, your supplier takes 10 days for delivery, and you want a 5-day safety margin: Reorder Point = (0.5 × 10) + (0.5 × 5) = 5 + 2.5 = 7.5 sets. You reorder when inventory drops to 7.5 sets, ordering enough to bring inventory back to your target level (which might be 20 sets, representing 40 days of stock).
ABC inventory classification: Not all parts are equally critical or expensive. Use ABC classification to apply different management strategies to different parts. A-class parts are high-value or high-failure-consequence items (engine overhauls, transmission components, major hydraulic systems) that warrant careful tracking and safety stock. B-class parts are medium-value items consumed at moderate rates (belts, hoses, filters, small electrical components) that need regular monitoring but less aggressive safety stock. C-class parts are low-value, high-volume consumables (oil, coolant, brake fluid, small fasteners) that can be ordered in bulk and consumed frequently. Applying emergency procurement to A-class parts is unacceptable—you should always maintain safety stock. Applying emergency procurement to C-class parts is less concerning since they're inexpensive and can usually be sourced quickly.
Supplier reliability assessment: Your reorder points should reflect supplier reliability. If a supplier consistently delivers on time or early, you can set lower safety stock. If a supplier is inconsistent or frequently delays, you need higher safety stock to account for potential late deliveries. Similarly, if a parts supplier experiences supply chain disruptions (semiconductor shortages affecting electronic components, manufacturing delays affecting major assemblies), increase your safety stock for those parts. The added carrying cost is worth the protection against stockouts.
Lead time reduction strategies: The longer your supplier's lead time, the higher your reorder point must be. Shortening lead time reduces required inventory. Strategies to reduce lead time include: establishing multiple suppliers so you can order from the fastest source, moving inventory closer to your facility (drop-shipping from regional distributors instead of national suppliers), pre-ordering seasonal parts before peak demand, and negotiating expedited shipping for critical items.
Emergency Procurement Cost Management: Why Reactive Ordering Is Expensive
When a bus fails and you need a replacement part immediately, you're forced into emergency procurement. The part must arrive today or tomorrow, not in the standard 2-week lead time. This urgency creates costs at every step: expedited shipping (2-3x normal shipping cost), supplier premium pricing (suppliers charge more for immediate availability), potential overnight delivery fees, and potentially higher part pricing from expedited sources who may not be your preferred supplier.
Emergency procurement cost structure: A transmission solenoid that costs $150 with normal ordering might cost $225 with expedited shipping and premium supplier pricing. Multiply this by 30-50 emergency orders per year in a mid-size transit fleet, and you're paying an extra $2,250-$3,750 annually just on one part category. A 60-bus transit fleet might experience 200-300 major component failures per year requiring emergency parts procurement. If 20% of these are handled through emergency channels (40-60 emergency orders), and each emergency order averages $80 in excess cost compared to planned procurement, you're spending an extra $3,200-$4,800 annually on emergency procurement premiums. Across all parts and repair categories, emergency procurement can add $15,000-$40,000 to annual maintenance costs for a mid-size fleet.
Bus downtime cost implications: Beyond the parts premium, there's the cost of bus downtime. A 40-seat transit bus that operates on a typical route might generate $200-$400 in revenue per day. If a bus is out of service for 2 days waiting for an emergency part, that's $400-$800 in lost revenue plus $150-$300 in crew costs (drivers paid but not generating revenue). A fleet with 10 buses down simultaneously for 2 days each costs $4,000-$8,000 in lost revenue. Proactive inventory management that prevents most failures reduces downtime and associated costs.
Maintenance schedule disruption: When a bus fails unexpectedly and requires emergency parts, it disrupts the maintenance schedule. Mechanics who were scheduled for planned maintenance might be diverted to emergency repairs. This cascades into delayed maintenance for other buses, creating more failures and more emergency orders. A systematic approach to parts inventory breaks this cycle by enabling maintenance to proceed on schedule with parts always available.
CMMS-Based Parts Tracking: Automating Inventory Management
A Computerized Maintenance Management System (CMMS) with integrated parts inventory management automates demand forecasting, reorder point monitoring, and automatic purchase order generation. Instead of manually checking inventory levels and submitting purchase orders, the system monitors consumption rates, calculates reorder points, and generates purchase requisitions automatically when thresholds are reached.
CMMS inventory module capabilities: Modern CMMS platforms include inventory management modules that track: part specifications (name, number, supplier, cost, lead time), current stock levels (quantity on hand, location in warehouse), consumption history (parts used per month, parts used by bus model, parts used by maintenance category), reorder points and target stock levels (automatically calculated based on consumption rate and lead time), supplier information (contact, pricing, lead time, reliability rating), and automatic purchase order generation (when stock falls to reorder point).
Integration with maintenance work orders: When a mechanic completes a maintenance work order that includes parts consumption (oil change kit, brake pad set, filter, etc.), the CMMS automatically reduces inventory for those parts. The system tracks which parts were used, accumulates consumption data, and triggers reorder points when inventory drops to threshold levels. This creates a closed loop: maintenance work triggers inventory reduction, reduced inventory triggers purchase orders, purchase orders create receiving transactions that increase inventory, and consumption data feeds back into demand forecasting.
Supplier cost negotiation with data: CMMS consumption data allows you to negotiate better pricing with suppliers. You can provide suppliers with your actual consumption data showing exactly how many units of a specific part you consume annually. Armed with this information, suppliers can offer volume discounts. A supplier seeing that you consume 120 units of a specific brake pad set per year might offer 8-12% volume discounts. Over the course of a year, that discount could save $2,000-$3,000 on that one part category.
Obsolescence management: As buses age and are retired from service, their components become obsolete and no longer needed. You might have 20 units of a transmission part specific to a 2008 bus model that no longer exists in your fleet. The CMMS should flag slow-moving inventory and obsolete parts so you can liquidate them (through salvage operations, selling to other fleets, or donating) rather than letting them accumulate shelf space and carrying cost.
Warehouse Organization and Parts Accessibility
Even with perfect inventory management, parts are only useful if mechanics can find them quickly. Warehouse organization directly affects maintenance productivity. A mechanic who spends 20 minutes searching for a part instead of 2 minutes wastes 18 minutes of labor per part. Multiply this by 5-10 parts per maintenance job and 10-15 maintenance jobs per day, and you're losing 15-30 hours per week of mechanic productivity to inefficient warehouse organization.
Location-based organization system: Implement a systematic warehouse organization where every part has a specific location (rack number, shelf position, bin identifier). The CMMS tracks part locations so mechanics can quickly find parts without searching. When a part is received, it's assigned a location and logged in the system. When a mechanic pulls a part for a work order, the system records the location and updates inventory. This creates efficiency and accountability.
Critical parts accessibility zone: High-consumption parts and emergency parts should be stored in the most accessible locations. A primary oil, air filters, brake pads, and transmission fluid should be immediately accessible in a dedicated high-demand zone. Less frequently used parts can be stored in secondary locations that require more effort to access. This priority-based organization reduces average retrieval time for the most commonly needed parts.
Visual inventory management: In addition to CMMS tracking, use visual inventory management so mechanics can quickly assess stock levels. Color-coded bin systems (green = adequate stock, yellow = approaching reorder point, red = critical low stock) provide immediate visual feedback without requiring a computer lookup. Bin labels with part numbers and SKUs prevent picking the wrong part when multiple similar parts are stored nearby.
Parts Inventory Management Questions
How much inventory should we actually carry in a transit fleet?
Industry standard is 30-60 days of projected consumption for A-class parts (critical components), 20-30 days for B-class parts, and 15-20 days for C-class parts. The exact amount depends on supplier lead time, fleet size, consumption variability, and risk tolerance. A 60-bus fleet typically maintains $50,000-$100,000 in parts inventory.
What's the typical cost of emergency parts procurement versus planned ordering?
Emergency procurement costs 30-50% more than standard procurement due to expedited shipping, supplier premiums, and higher sourcing costs. A mid-size fleet spending $200,000 annually on parts with 20% emergency procurement ($40,000) could save $12,000-$20,000 annually by shifting to proactive inventory management.
How do we handle parts that have long lead times (6+ weeks)?
Long-lead-time parts (engine blocks, transmission cases, major assemblies) require special handling. Set reorder points at 1.5x normal levels to account for extended lead time. Consider pre-ordering these parts before they're needed. Establish secondary suppliers for backup sourcing if primary supplier delivery is delayed.
Should we stock parts for buses we're planning to retire soon?
No. Once a bus is scheduled for retirement (within 6-12 months), stop stocking parts specific to that model unless they're shared with other buses. Liquidate remaining inventory of model-specific parts through salvage operations or donations. This frees warehouse space and reduces carrying costs.
How often should we review and update our reorder points?
Review reorder points quarterly or when consumption patterns significantly change. After fleet changes (adding new bus models, retiring old buses, changing routes), recalculate all reorder points based on updated consumption data. Quarterly reviews catch seasonal variations and supplier lead time changes.
What's the best way to manage parts from multiple suppliers?
Use CMMS supplier tracking to monitor lead time and reliability for each supplier. Set reorder points based on the most reliable supplier's lead time. Use secondary suppliers for backup if the primary supplier is delayed. Negotiate volume discounts based on combined consumption data to encourage suppliers to compete on pricing and service.
How do we handle price fluctuations in volatile parts markets?
Monitor commodity prices and adjust order quantities during price dips. If diesel engine components are experiencing temporary price reductions, increase order quantities to build safety stock at lower cost. Conversely, reduce order quantities when prices spike temporarily unless consumption is imminent. CMMS tracking gives you the data to make these tactical decisions.
Optimize Your Parts Inventory Today
Systematic parts inventory management reduces emergency procurement costs by 40-50%, improves fleet uptime, and frees cash tied up in excess inventory. Use demand forecasting, reorder point analysis, and CMMS automation to manage parts inventory like leading transit agencies.