For public transit authorities, private motor coach operators, and municipal school districts, determining the perfect fleet size is a continuous financial and operational balancing act. Fleet managers face a daily high-stakes puzzle: maintain too few spare vehicles, and a sudden wave of mechanical breakdowns or component failures will immediately result in missed routes, stranded passengers, and severe regulatory non-compliance fines. Conversely, carrying an excessive number of backup vehicles means tying up millions of dollars of public or corporate capital in idle assets that incur depreciating lifespans, insurance premiums, and ongoing garage storage costs. To establish an industry baseline, the Federal Transit Administration recommends a standard spare ratio of 12% to 15% for transit systems operating 50 or more fixed-route assets. However, a spare ratio is never a fixed, permanent number. A fleet’s true backup requirement changes depending on real-world operational variables: fleet age, climate, mechanic capability, and maintenance quality. Transitioning away from guess-based fleet padding and using data-driven insights allows transportation directors to optimize capital safely. This guide explores the variables governing transit spare ratios, calculation methods required for audits, and a practical playbook to lower spare requirements through a centralized CMMS platform.
Fleet Planning
Transit Spare Ratio & Fleet Sizing Guide: Optimizing Assets
Carrying too few spares leads to missed routes and broken schedules, while carrying too many drains capital. Discover how to calculate, justify, and optimize your asset reserve array.
The Core Mathematical Baseline of Transit Fleet Optimization
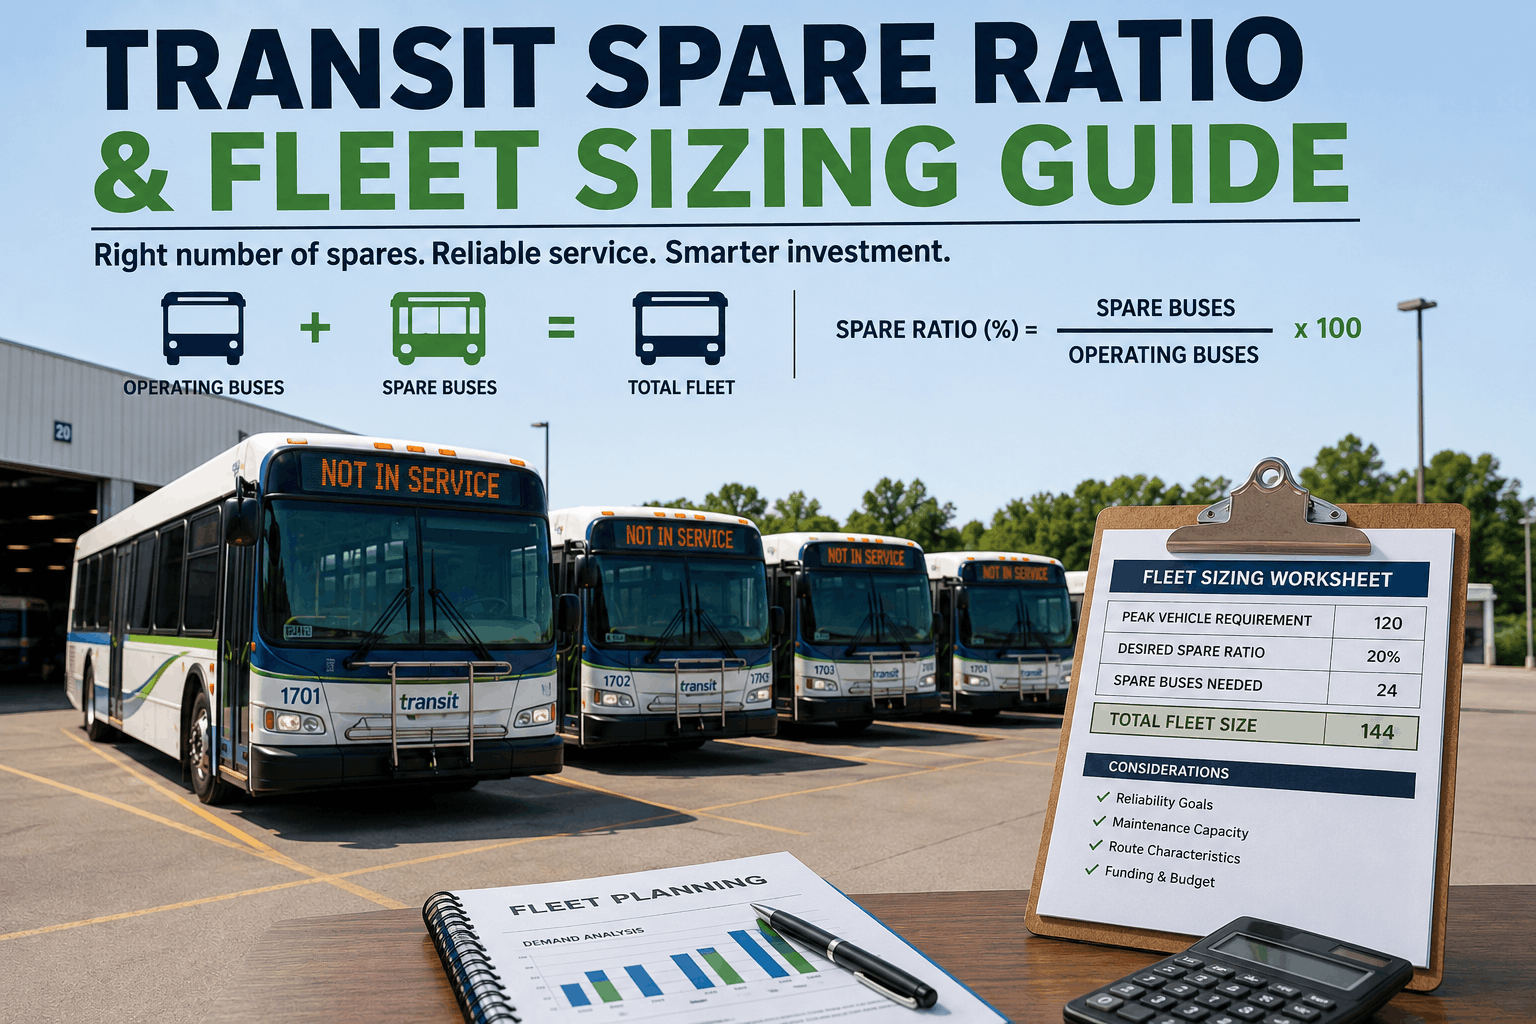
To remain compliant with oversight expectations and maintain route reliability, transit operations must understand the exact formulas used to calculate active reserve capacities. The spare ratio expresses the number of operational backup vehicles as a percentage of the maximum number of vehicles required for active service schedules.
Standard Fleet Allocation Calculation
Formula: Spare Ratio (%) = [(Total Fleet Size - Peak Vehicle Requirement) / Peak Vehicle Requirement] × 100
Peak Vehicle Requirement: The maximum number of buses running active routes simultaneously during peak morning or evening demand.
Active Spare Array: The backup pool used to cover scheduled PM maintenance, unexpected repairs, or roadside incidents.
Resulting Fleet Profile: Total Fleet Size = 51 Buses | Peak Vehicle Requirement = 45 Buses | Spare Ratio = 13.3%
Four Core Realities That Artificially Bloat Your Spare Vehicle Requirements
When a transportation department regularly exceeds a practical spare ratio baseline, it is often a symptom of deeper operational inefficiencies on the garage floor.
Reason 1: Extended Component Mean Time to Repair
Poor shop workflow planning can drag a simple repair across several days, keeping that bus out of service and increasing reliance on the spare pool.
Reason 2: Unpredictable Parts Stockouts and Order Delays
If replacement parts are not available, the asset remains stuck in the shop waiting on emergency shipping, forcing managers to pull another spare.
Reason 3: Accelerated Aging Profiles of Legacy Powertrains
As buses pass mid-life milestones, cooling issues, leaks, electrical faults, and structural problems increase, requiring a larger reserve buffer.
Reason 4: Reactive, Emergency-Driven Shop Cultures
Operating without systematic preventive maintenance keeps technicians focused on emergency repairs instead of preventing failures before they happen.
Strategic Visibility Zones: Evaluating Fleet Health vs. Fleet Sizing
To justify asset allocation to boards, councils, or auditors, your maintenance operation must track key operational segments simultaneously.
Drivetrain Operational Metrics vs. Capital Reserve Demands
Zone: The Daily Out-of-Service Baseline Tracker
This represents the percentage of the fleet red-flagged in the garage for safety issues, engine faults, or structural damage.
Zone: Scheduled Preventive Maintenance Lifecycle Windows
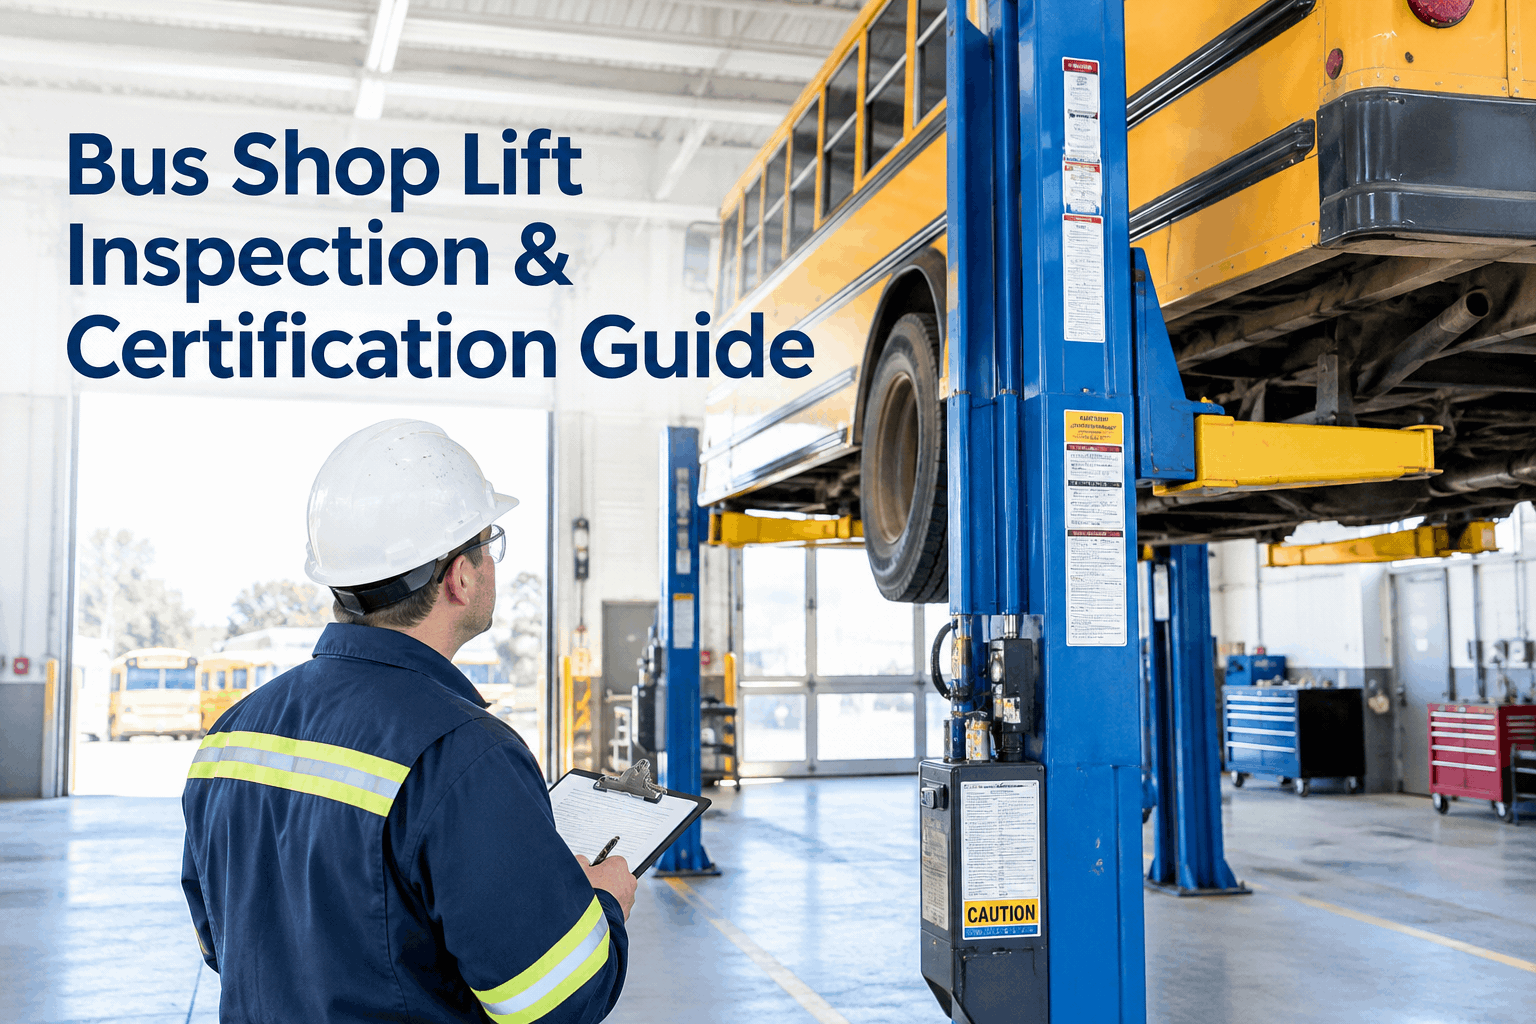
A portion of your spare pool must always be reserved to cycle healthy buses into the bay for routine maintenance.
Zone: Seasonal Environmental Stress Factors
Extreme winter temperatures and summer heatwaves increase battery, air line, cooling, and AC system failures.
Zone: Capital Rehabilitation and Mid-Life Overhaul Windows
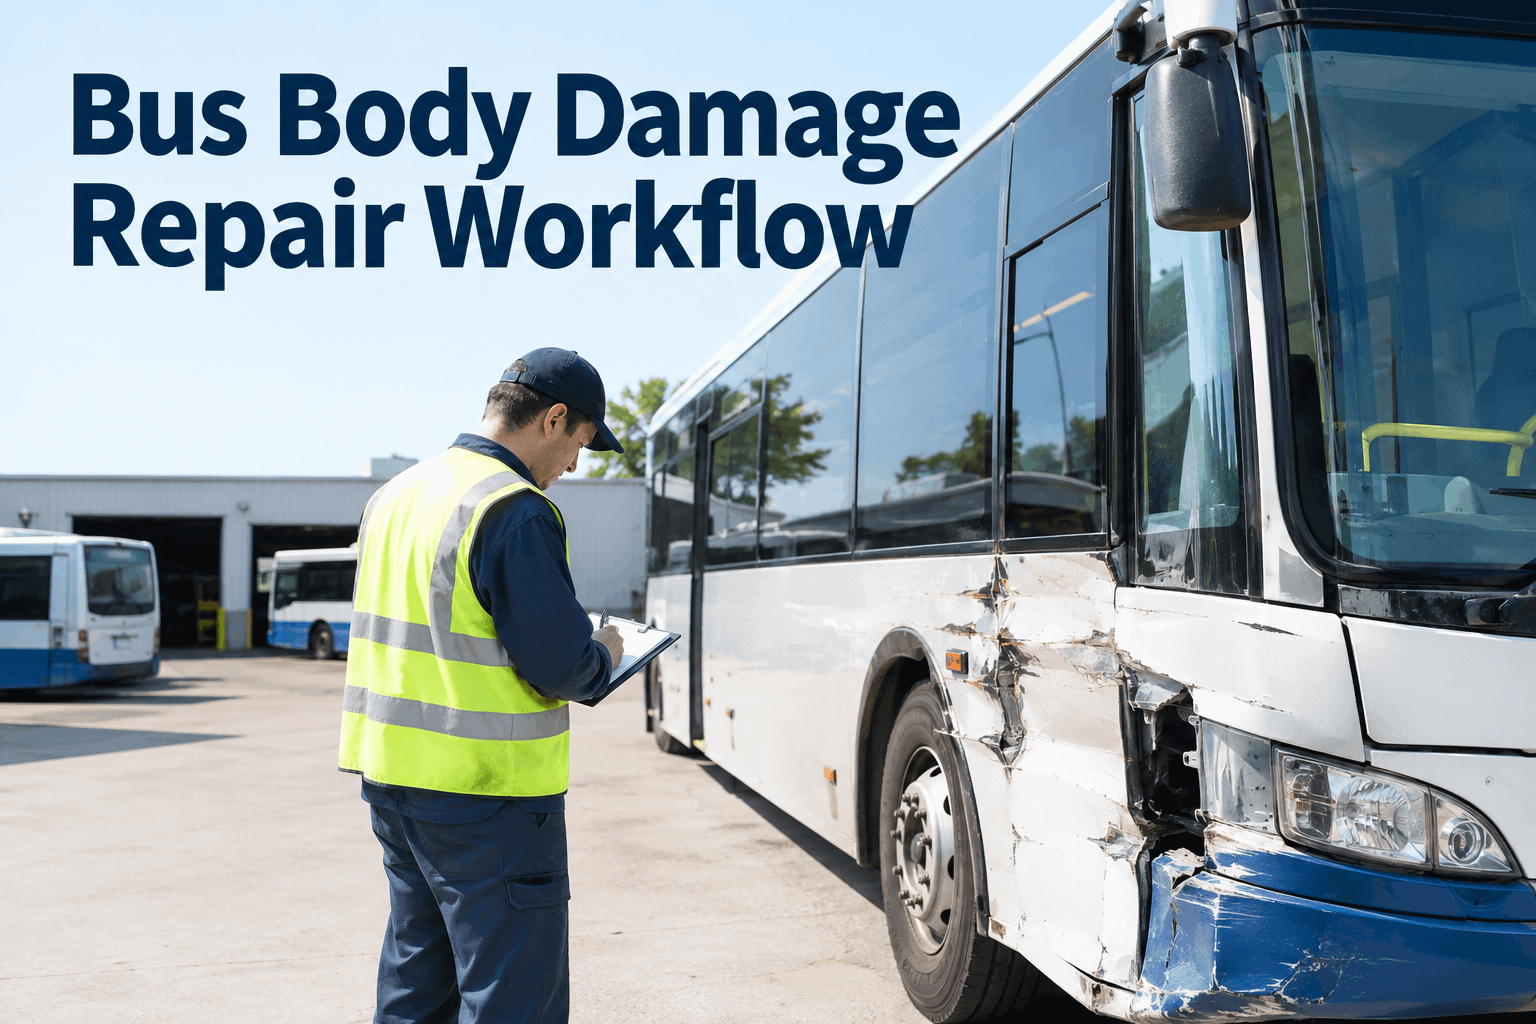
Major structural updates, engine rebuilds, or frame projects can take weeks per vehicle and must be included in long-term spare modeling.
The Playbook: How to Lower Your Spare Ratio Requirement Using a Digital CMMS
The most effective way to save capital is not simply buying more buses. It is increasing the uptime and reliability of the assets you already own.
1
Automate Engine-Hour Triggered Preventive Maintenance Loops
Configure your fleet management system to use odometer and engine-hour updates so PM tasks are scheduled before wear becomes failure.
2
Streamline Parts Inventory and Min/Max Reordering
Connect work orders to real-time inventory so critical parts like belts, filters, brake kits, and suspension components are available when needed.
3
Digitize Pre-Trip DVIR Workflows to Intercept Faults Early
Use structured mobile inspection checklists so safety faults instantly reach the shop dashboard before they become route failures.
4
Track Mechanic Turnaround Trends and Labor Allocation Metrics
Monitor repair cycles and mechanic efficiency by repair type to identify training gaps, tool shortages, and process bottlenecks.
"We were caught in a brutal cycle, operating a regional transit fleet of 50 assets with a thin 8% spare ratio. Our aging buses were experiencing frequent electrical and cooling failures, which constantly forced us to cancel active routes. We initially assumed the solution was to buy new backup buses. Instead, we deployed a specialized digital bus CMMS, moved away from manual whiteboards, and established strict engine-hour driven PM workflows. We cleared our maintenance backlog, optimized our parts room, and dropped our mean time to repair by over 40%. Proactive maintenance allowed us to protect routes and save capital."
— Director of Fleet Logistics, Great Lakes Regional Transit Authority, Michigan
Right-Size Your Capital Investment and Guarantee Flawless Route Execution
Stop protecting your transit routes through expensive vehicle hoarding. Streamline shop turnaround times, eliminate unexpected part delays, and build data-backed compliance reports using an advanced fleet management solution.