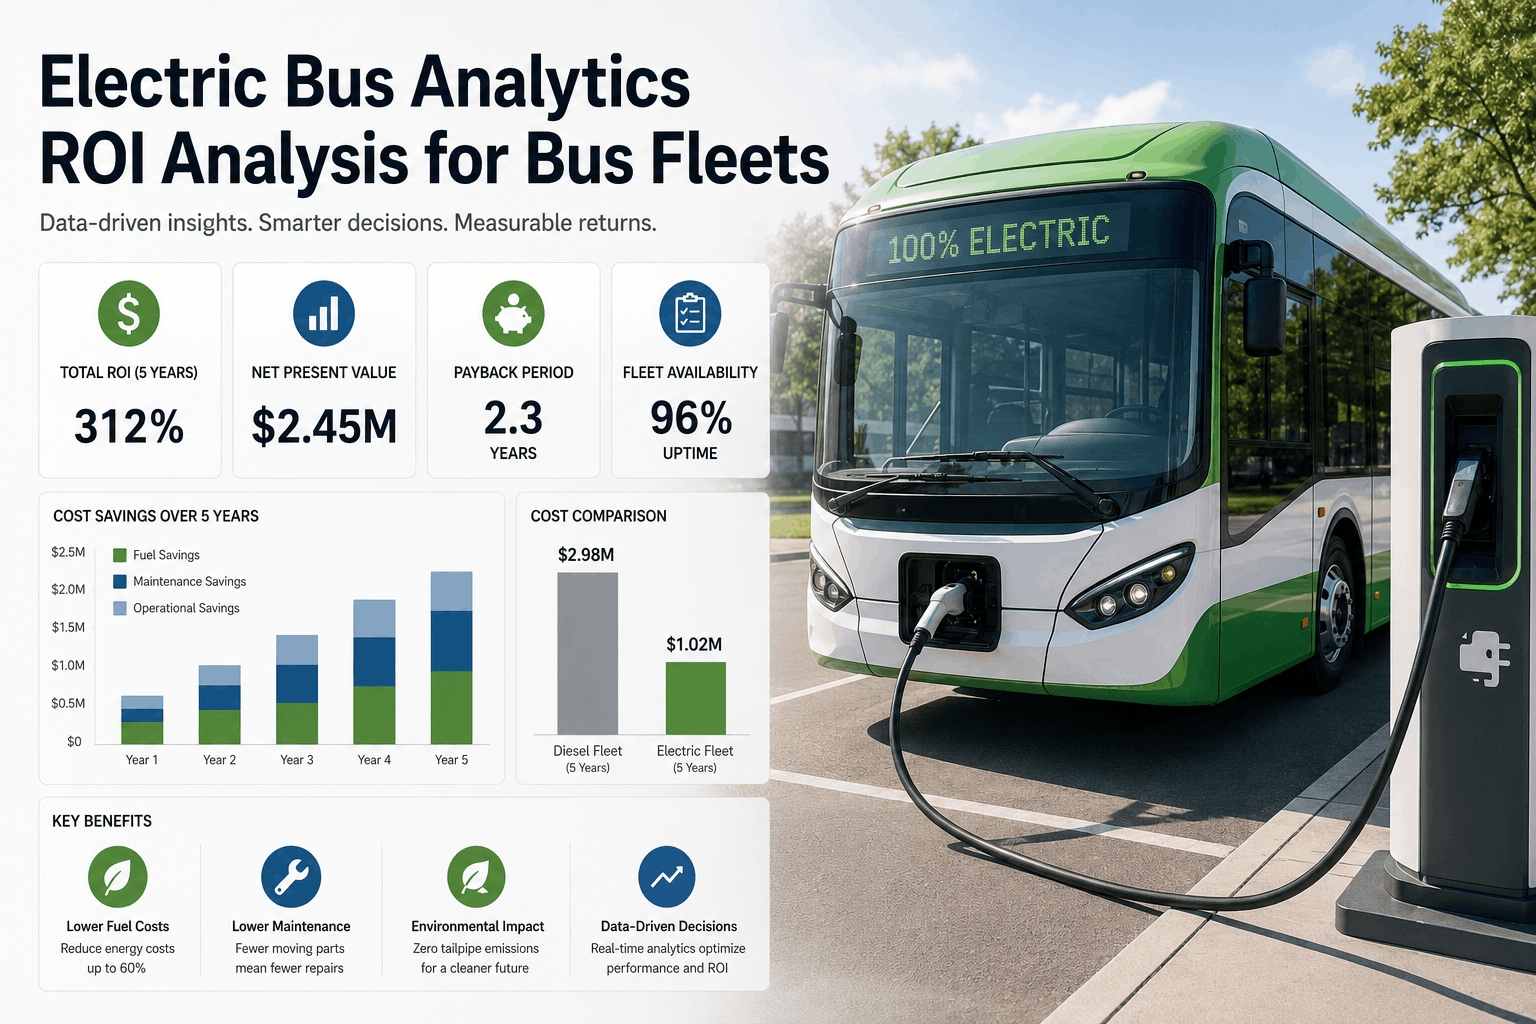
The EPA Clean School Bus Program has committed $5 billion to replace diesel buses with zero‑emission models, and hundreds of U.S. school districts are now running electric buses alongside their traditional fleets. But while the environmental promise is clear, the operational question remains: how does a transportation director measure the true return on investment of an electric bus when the data sits scattered across utility bills, telematics portals, and handwritten charging logs? School bus scheduling and fleet analytics must evolve to capture kilowatt‑hours per mile, battery state‑of‑health, and regenerative braking efficiency with the same precision that diesel fleets have tracked fuel burn for decades. BusCMMS provides the first electric‑bus‑native analytics platform that unifies charging data, maintenance intervals, and compliance records into a single ROI dashboard — so districts can prove that every electric bus on the route is delivering the promised savings. This guide walks through the analytics framework that turns raw electric bus data into a compelling, board‑ready ROI story.
Measure the Real ROI of Every Electric Bus
BusCMMS tracks kWh consumption, battery health, and maintenance costs for electric, propane, and diesel buses on one dashboard — built for school district fleets.
Why Electric Bus ROI Requires a Different Analytics Approach
A diesel bus has fuel receipts and a well‑understood preventive maintenance schedule — oil changes every 5,000 miles, transmission flushes at 25,000. An electric bus replaces those with charging costs, battery degradation curves, and high‑voltage system inspections. Without integrated maintenance analytics, districts risk making fleet purchasing decisions based on vendor promises rather than observed operational data. The National Renewable Energy Laboratory reports that electric school buses can reduce fuel and maintenance costs by 60–70% over their lifetime, but only when districts actively monitor key performance indicators — charging efficiency, regenerative brake energy capture, and battery thermal management alerts. BusCMMS captures all of these automatically, pulling telematics data from Samsara and Geotab into a single fleet operations view, so a fleet manager can compare the cost per mile of an electric Blue Bird against a diesel Thomas Built bus side by side, every quarter.
Diesel vs. Electric Bus: The Analytics That Drive ROI Comparison
| Performance Metric | Diesel Baseline | Electric (with BusCMMS Tracking) |
|---|---|---|
| Fuel / Energy Cost per Mile | $0.38–$0.45 | $0.08–$0.14 |
| Scheduled PM Events per Year | 6–8 (oil, filters, belts) | 2–3 (coolant, brake fluid, HV check) |
| Brake Service Interval | 25,000 miles | 80,000+ miles (regenerative braking) |
| Annual Maintenance Cost per Bus | $9,500–$12,000 | $3,500–$4,500 |
| Battery Health Monitoring | Not applicable | State‑of‑health dashboard, degradation alerts |
| Charging Schedule Compliance | Not applicable | Auto‑logged charging sessions, cost per kWh |
BusCMMS Electric Bus Analytics That Prove ROI
BusCMMS reads telematics data to calculate real‑time energy consumption, then multiplies by your district’s utility rate to show the exact cost of charging each bus, every day.
The platform captures battery capacity, charge cycle count, and cell voltage balance, alerting you if a battery degrades faster than expected — before it impacts a morning route.
Pre‑loaded electric‑specific DVIR checklists cover HV cables, battery coolant levels, and contactor function — ensuring compliance with manufacturer safety requirements.
Align charging windows with off‑peak utility rates and route demands. BusCMMS suggests charging windows that minimize cost while guaranteeing full batteries at pull‑out.
A side‑by‑side view of total cost per mile, maintenance events, and fuel/energy spend for each fuel type, updated in real time as work orders and charging data come in.
Generate reports showing electric bus utilization, emissions reduction, and operational savings — formatted for EPA Clean School Bus Program progress filings and state incentive programs.
Six Steps to Integrate Electric Bus Analytics into Your Fleet
BusCMMS integrates natively with Samsara and Geotab to pull battery state‑of‑charge, odometer, and fault codes automatically — no manual data entry required.
Set intervals for HV system inspections, coolant changes, and brake fluid flushes based on manufacturer guidelines. BusCMMS triggers work orders and logs compliance.
Record every charging session — start time, kWh delivered, and cost — within the asset history. The system flags incomplete charges that could disrupt the next route.
Replace generic inspection forms with pre‑loaded electric bus checklists that cover HV cable condition, battery coolant level, and charging port operation.
Use BusCMMS’s comparative analytics to track per‑mile costs and maintenance frequency across fuel types. Share the dashboard with the board to justify further electric bus purchases.
Pull pre‑built reports showing kWh consumption, emissions reduction, and operational savings. Submit them directly to the EPA or your state’s clean transportation program office.
We added four electric buses last year and struggled to prove they were saving money until BusCMMS. Now I can show the board a real‑time cost comparison — kWh versus diesel, brake wear reduction, and zero oil changes. Our ROI payback is on track for 3.1 years, exactly as promised.
Frequently Asked Questions
What electric bus metrics does BusCMMS track that a diesel CMMS ignores?
BusCMMS monitors kWh per mile, battery state‑of‑health, charging session costs, regenerative braking efficiency, and high‑voltage system inspection compliance — all missing from diesel‑only platforms.
Can BusCMMS manage a mixed fleet of diesel, propane, and electric buses?
Yes, the platform runs separate PM schedules and analytics dashboards for each fuel type simultaneously, giving you a single view of the entire fleet without data silos.
How does electric bus analytics help with EPA Clean School Bus Program reporting?
BusCMMS generates utilization and emissions‑reduction reports formatted for EPA submissions, documenting that your electric buses are operating as grant agreements require.
Does BusCMMS calculate the total cost of ownership for electric versus diesel buses?
Yes, the ROI dashboard compares fuel/energy costs, maintenance spend, and parts consumption per mile for each fuel type, giving you a continuously updated TCO picture.
What if our electric buses use different charging station brands — can BusCMMS still pull data?
BusCMMS captures charging data via the bus telematics system rather than the charger itself, so it works with any charging station brand connected to Samsara or Geotab.
How does battery health monitoring prevent unexpected route failures?
The platform tracks capacity fade and cell imbalance, alerting you when a battery may not complete a full route, so you can schedule a replacement or reassign the bus before a breakdown.
Is electric bus analytics included in the free BusCMMS tier for small fleets?
Yes, the free tier for up to 75 buses includes full electric bus analytics — kWh tracking, battery health, charging logs, and cost‑per‑mile dashboards — with no feature restrictions.
How quickly can we start seeing ROI data after implementing BusCMMS?
Districts typically see initial comparative cost data within the first month, and enough trend data for a board‑ready ROI presentation within the first full quarter of operation.
Turn Electric Bus Data into a Proven ROI Story
BusCMMS gives your district the analytics to track every kilowatt‑hour, every brake service avoided, and every grant dollar justified — all on a single, electric‑ready platform.