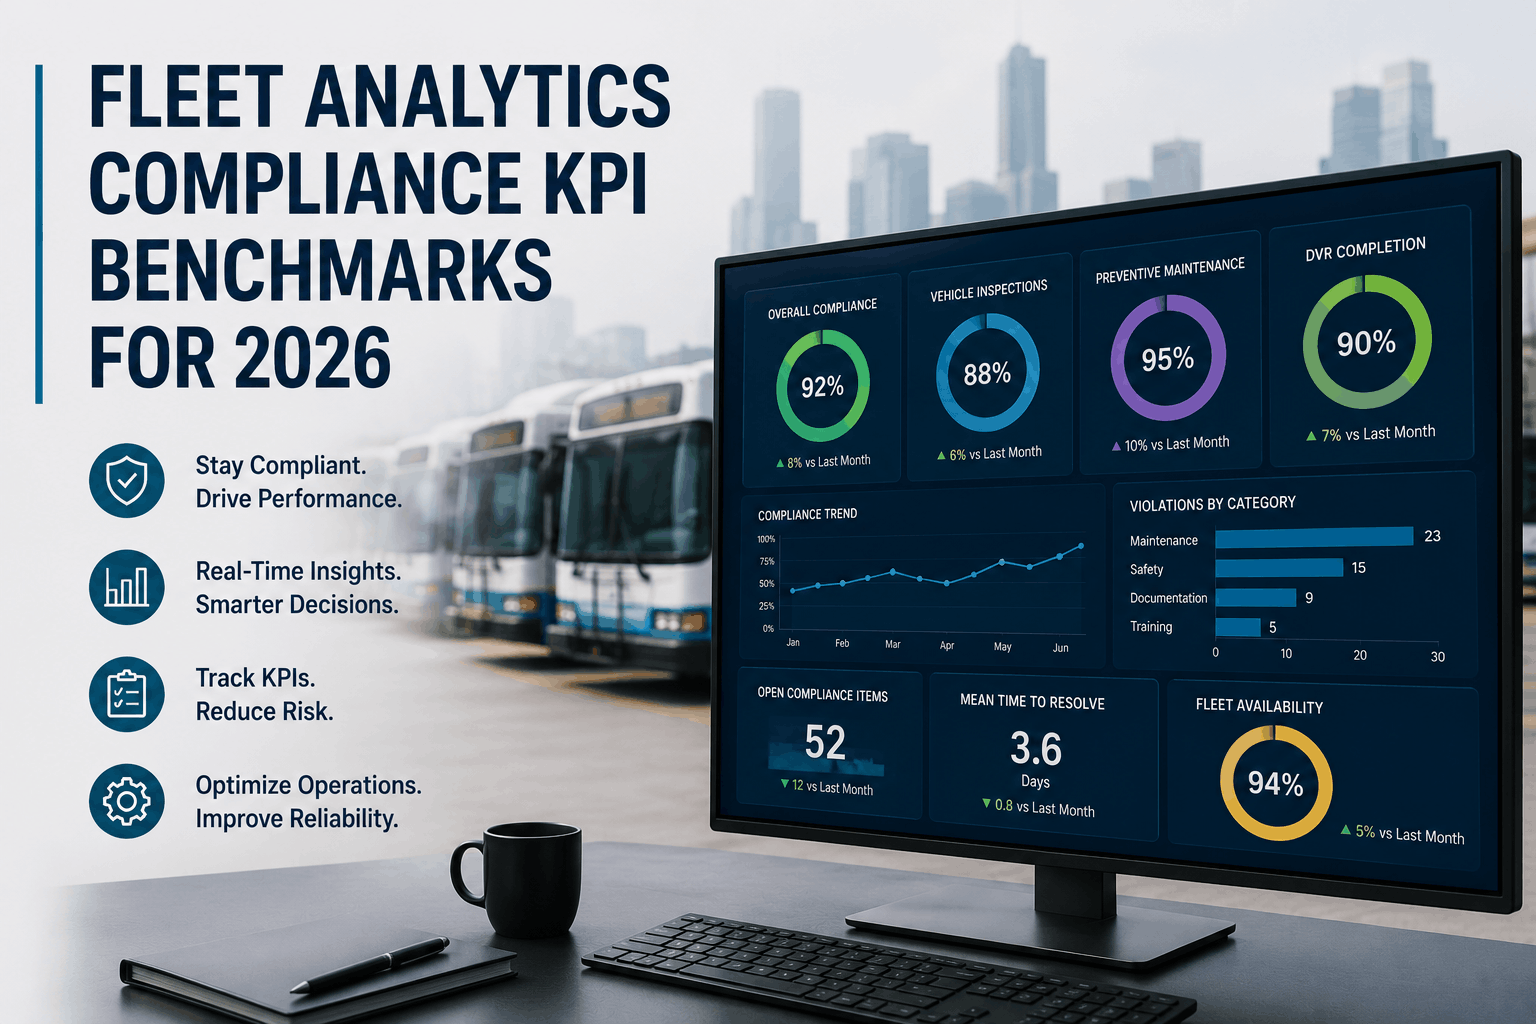
School districts that track maintenance with paper logs and memory rarely know their true fleet scheduling compliance posture until a state auditor asks for 12 months of DVIR records. Fleet analytics — the systematic measurement of PM completion, inspection closure rates, road‑call frequency, and cost per mile — turns compliance from a last‑minute scramble into a predictable, dashboard‑driven routine. The FMCSA’s 2026 eDVIR rule (FMCSA‑2025‑0115) and standing 49 CFR 396 requirements mean that districts without digital fleet analytics face not only operational friction but regulatory exposure. BusCMMS closes that gap by embedding maintenance analytics directly into the same platform that manages work orders, parts inventory, and driver inspections — so transportation directors see compliance KPIs on the same screen where they approve repairs. This guide maps the 2026 fleet analytics benchmarks that separate audit‑ready fleets from those that discover compliance gaps during an investigation.
See Every Compliance KPI Before the Auditor Does
BusCMMS auto‑generates PM compliance rates, inspection completion percentages, and cost‑per‑mile trends on one dashboard — built specifically for school bus fleets.
Why Manual Compliance Tracking Fails U.S. School Districts
The National Association of State Directors of Pupil Transportation Services reports that one in four school bus fleets cannot produce a complete set of inspection records within 24 hours when an FMCSA auditor requests them. The root cause is not negligence — it is the absence of an analytics layer that connects fleet operations data to compliance requirements. When a driver’s pre‑trip defect scribble sits in a binder, and a technician’s repair note lives in a separate file, no one can see that PM compliance has slipped to 61% across the fleet until buses start failing pull‑out checks. BusCMMS aggregates every DVIR, work order, and inspection event into a live compliance dashboard, giving transportation directors the same level of visibility that air‑carrier safety managers have had for decades. Fleets using structured fleet planning analytics consistently close 95% of corrective work orders within 48 hours and pass DOT audits with zero findings — outcomes that reactive fleets only dream about.
The 2026 Fleet Analytics Benchmarks That Matter Most
| Compliance KPI | FMCSA Requirement | BusCMMS Automated Tracking |
|---|---|---|
| PM Completion Rate | Systematic schedule required (49 CFR 396.3) | Live PM‑A/B/C dashboard by fuel type |
| DVIR Defect Closure Time | Defects must be corrected before dispatch | One‑click defect‑to‑WO, measured in minutes |
| Annual Inspection Records | Retain 14 months (49 CFR 396.21) | Auto‑stored, audit‑ready on demand |
| Emergency Exit 90‑Day Checks | Documented every 90 days | Pre‑loaded checklists, auto‑logged |
| Fleet Availability at Pull‑out | No specific metric, but tied to safety | Real‑time bus status dashboard |
| Cost per Mile Tracking | Not mandated, but essential for budgeting | Cumulative parts + labor per bus automatically |
Six Analytics Workflows That Make Compliance Automatic
The difference between a fleet that scores “satisfactory” on a DOT audit and one that uncovers missing records under pressure comes down to whether analytics run in the background or require manual extraction. BusCMMS provides these six maintenance reporting and analytics workflows purpose‑built for school bus compliance.
PM compliance percentage, open work order aging, inspection completion rate, and fleet availability status all on one screen — refreshed automatically from every driver inspection and repair event.
BusCMMS tracks every pre‑trip, post‑trip, and 90‑day emergency exit check and compiles completion percentages by driver, by bus, and by month — audit evidence ready in seconds.
When a bus crosses a PM mileage threshold, BusCMMS generates the work order and logs the due date into the compliance calendar — no manual scheduling, no missed intervals.
See which defect types recur most often, which buses generate the most write‑ups, and whether defects are being closed before the next dispatch — a compliance trend line the FMCSA expects.
Samsara and Geotab fault codes flow directly into BusCMMS as work orders, and the analytics engine tracks how long each code takes to resolve, helping you meet the standard of prompt corrective action.
Every quarter, pull a report showing PM compliance rate, inspection completion, and defect closure time trends — perfect for board presentations and for demonstrating continuous improvement to state auditors.
How to Build a Data‑Driven Compliance Culture in Your School Bus Fleet
Transitioning from reactive compliance to analytics‑led assurance follows a proven sequence. BusCMMS deploys in under three weeks, and each step below is supported by pre‑configured workflows that require no custom coding or spreadsheet design. The path to audit‑ready fleet efficiency starts with connecting every daily operation to a measurable KPI.
Move all pre‑trip and post‑trip DVIRs into BusCMMS’s mobile app. Defects appear in the shop queue instantly, and the system logs inspection completion timestamps for every driver — building the foundational analytics data set.
Select the compliance metrics that matter most for your district — PM rate, defect closure time, inspection completion — and arrange them on a single screen. The dashboard updates automatically as work orders close and inspections are submitted.
Enter mileage thresholds for PM‑A, PM‑B, and PM‑C for each bus in the fleet. BusCMMS uses GPS odometer sync to trigger work orders exactly when service is due, logging compliance automatically.
Schedule a 15‑minute Monday morning huddle where the transportation director and lead technician review the dashboard together. Open work orders older than 48 hours get flagged, and any bus approaching a service window is highlighted.
After 60 days, review the DVIR defect analytics. Identify which bus models generate repeat write‑ups and which drivers flag the most valid defects — data that informs both maintenance planning and driver training.
Pull BusCMMS’s pre‑built compliance trend reports every quarter. Present PM completion rates, cost per mile trends, and inspection closure percentages to demonstrate that the fleet is not only safe but financially accountable.
Our last state audit used to take three days of pulling paper files from cabinets. With BusCMMS, I had every inspection record, every PM confirmation, and every DVIR closure timestamp on my tablet before the auditor finished his coffee. We passed with zero findings. The compliance dashboard now sets the agenda for our weekly shop meeting.
Frequently Asked Questions
What fleet analytics KPIs does FMCSA require for school buses?
FMCSA 49 CFR 396 mandates systematic inspection and maintenance records but does not specify particular KPIs. However, auditors expect evidence of PM scheduling, defect correction, and annual inspection documentation — all of which BusCMMS tracks automatically.
How quickly can I see my fleet’s compliance health after implementation?
The live dashboard populates as soon as drivers begin submitting digital DVIRs. Within the first week, you will see inspection completion rates; within a month, PM compliance trends become visible.
Does BusCMMS help with the 2026 FMCSA eDVIR rule?
Yes. The eDVIR rule (effective March 23, 2026) explicitly authorizes electronic driver vehicle inspection reports. BusCMMS stores every DVIR submission with timestamps and signatures, meeting that regulation from day one.
Can I track compliance for a mixed diesel and electric bus fleet on one dashboard?
Absolutely. BusCMMS maintains separate PM schedules and compliance logs for diesel, propane, and electric buses, and all data feeds into the same fleet‑wide KPI dashboard without manual merging.
What if we already have a telematics system — do we lose that data?
No. BusCMMS has native connectors for Samsara and Geotab, so fault codes and odometer readings sync automatically and become part of your compliance analytics, eliminating dual data entry.
How does BusCMMS prove compliance during a DOT audit?
With one click, the platform generates a complete record set for any bus — annual inspections, 90‑day exit checks, DVIR history, and PM completions — all timestamped and organized per FMCSA retention requirements.
Can I set custom compliance alerts for my fleet?
Yes. BusCMMS allows you to define thresholds for PM due‑in reminders, open work order aging, and inspection gaps, so you receive proactive alerts before a compliance slip becomes a finding.
Is the analytics dashboard included in the free tier for smaller districts?
Yes. The free BusCMMS tier for fleets under 75 buses includes the full compliance KPI dashboard, DVIR analytics, and quarterly trend reporting — no hidden fees or feature gating.
Turn Compliance from a Panic into a Dashboard Metric
BusCMMS gives you the analytics infrastructure to pass every DOT audit, keep buses on the road, and prove fleet performance to the board — all without a single custom report or extra spreadsheet.







