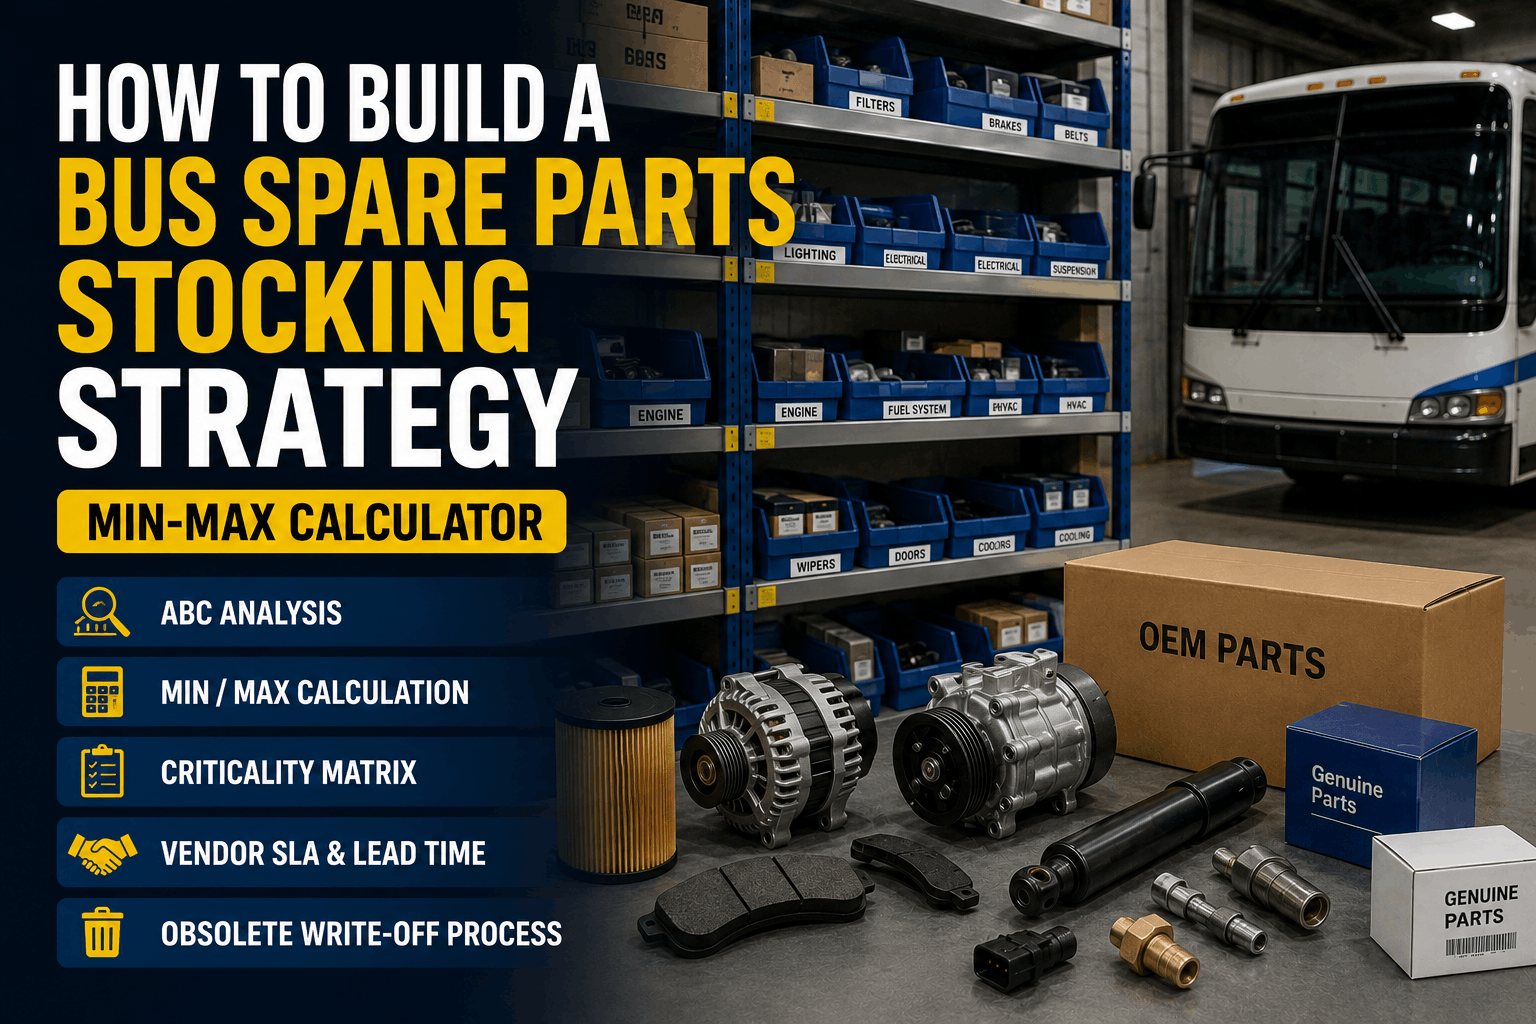
Effective spare parts stocking keeps your fleet running and prevents costly downtime. Without a strategy, fleets overstock low-usage items while running out of critical components. This guide walks you through building a min-max stocking strategy using ABC analysis, criticality matrices, and vendor SLAs to balance inventory cost and service levels.
How to Build a Bus Spare Parts Stocking Strategy 2026
How to Build a Bus Spare Parts Stocking Strategy (Min-Max Calculator)
Build a working spare parts strategy for a bus fleet. ABC analysis, min/max calculation, criticality matrix, vendor SLAs, obsolete write-off process.
The High Cost of Poor Parts Stocking
Unplanned downtime from a missing part can cost thousands per day. Overstocking ties up cash and increases carrying costs. A structured stocking strategy reduces both stockouts and excess inventory by up to 40%.
40%
Reduction in stockouts with min-max
$2,200
Average cost of one day of downtime
25%
Inventory carrying cost reduction
3x
ROI from optimized stocking levels
Building Your Stocking Strategy: Step-by-Step Progress
1
ABC Classification
Segment parts by annual spend. A-items (top 10%) get tight min-max controls; C-items (bottom 70%) use simpler reorder rules.
2
Criticality Analysis
Rate each part by downtime impact. Safety-critical and road-call parts require higher safety stock despite classification.
3
Set Min-Max Levels
Use demand history and lead time to calculate reorder points and max quantities. BusCMMS automates this with real-time usage data.
4
Vendor SLAs & Lead Times
Negotiate guaranteed lead times and consignment stock for critical A-items. Track vendor performance monthly.
5
Obsolete Stock Review
Quarterly review of non-moving parts. Write off obsolete inventory and adjust stocking rules to prevent re-accumulation.
ABC Parts Classification & Min-Max Levels
Classify parts by annual spend. A-items (top 10%) get tight min-max levels based on daily usage and lead time. B-items (next 20%) follow moderate controls. C-items (bottom 70%) use broad reorder points with higher safety stock to avoid administrative burden.
Parts Availability Trend After Strategy Implementation
Fleets using min-max stocking with BusCMMS see fill rates jump from 72% to 96% in 12 months. The biggest gains occur in the first quarter as A-item stockouts are eliminated through tighter controls.
5 KPIs to Measure Parts Stocking Effectiveness
Track these metrics monthly to ensure your stocking strategy stays aligned with fleet needs:
Fill Rate
Target: Above 95%. Percentage of parts requests fulfilled immediately from stock.
Inventory Turnover
Target: 4–6 turns per year. High turns indicate efficient use of working capital.
Stockout Incidents
Target: Zero for critical A-items. Track occurrences that cause road calls or delayed repairs.
Obsolete Stock Value
Target: Below 5% of total inventory. Write off non-movers quarterly to keep stock lean.
Vendor Lead Time Accuracy
Target: 95%+ on-time deliveries. Use performance data to adjust safety stock calculations.
Stocking Strategy Pass/Fail Checklist
ABC Classification
Pass: All parts segmented by annual spend, with different stocking rules per class.
Fail: One-size-fits-all reorder points ignoring spend and criticality.
Criticality Matrix
Pass: High-criticality parts have boosted safety stock regardless of ABC classification.
Fail: A cheap but essential part gets overlooked until it causes a road call.
Min-Max Logic
Pass: Reorder points based on demand history, lead time, and target service level.
Fail: Gut-feel ordering that leads to frequent stockouts or bloated shelves.
Vendor SLAs
Pass: Documented lead times and consignment arrangements for A-items.
Fail: No formal agreements; lead times are assumed or inconsistent.
Obsolete Stock Process
Pass: Quarterly reviews, write-offs, and removal of dead stock from active locations.
Fail: Shelves full of unused parts that distort true inventory value.
System Integration
Pass: CMMS auto-generates purchase requisitions when min levels are breached.
Fail: Manual checks that delay replenishment and cause stockouts.
We implemented ABC classification and min-max stocking with BusCMMS for our 200-bus fleet. Stockouts dropped by 45% in the first quarter, and inventory value shrank by 22% without compromising availability. The system's automatic reorder alerts keep our critical parts on hand without manual intervention.
Turn Your Stockroom into a Strategic Advantage
BusCMMS automates ABC classification, min-max calculations, and vendor order management. Know exactly what to stock, when to reorder, and how to eliminate downtime caused by missing parts.
Spare Parts Stocking FAQs
How do I calculate min and max stock levels?
Min level = (daily demand × lead time) + safety stock. Max level = min level + order quantity. BusCMMS uses your actual usage data and supplier lead times to set and update these dynamically.
What is ABC analysis for bus parts?
ABC analysis ranks parts by annual dollar usage. A-items are the top 10% that account for 70% of spend. They need tight min-max control. B and C items use progressively simpler replenishment rules.
How often should I review stocking levels?
Review A-items monthly, B-items quarterly, and C-items semi-annually. BusCMMS flags items where demand has shifted significantly so you can adjust min-max on the fly.
How does BusCMMS help with parts inventory?
BusCMMS tracks parts usage per vehicle, calculates reorder points, generates purchase orders automatically when stock hits min, and provides dashboards for fill rate, turnover, and obsolete stock value.
What is a criticality matrix for spare parts?
A criticality matrix rates parts by the impact of a stockout on safety and operations. Parts that cause road calls or safety issues receive higher safety stock regardless of their dollar value.
Can I use consignment stock for bus parts?
Yes, many suppliers offer consignment arrangements for high-value A-items. The supplier owns the stock until used, reducing your carrying cost while ensuring availability. BusCMMS tracks consigned inventory separately.
The Bottom Line
A data-driven spare parts stocking strategy transforms your parts room from a cost center into a reliability driver. By segmenting inventory with ABC analysis, applying criticality ratings, and setting min-max levels based on actual demand, fleets achieve 96% fill rates while reducing inventory value. The five-step process—classification, criticality, min-max calculation, vendor SLAs, and obsolete stock management—delivers measurable ROI within months. Use the five KPIs to keep your program on track, and leverage BusCMMS to automate the entire cycle so your technicians always have the right part at the right time.