A 300-bus school district in Florida was spending $6.2 million annually on maintenance and operations. Buses were breaking down at an increasing rate. PM compliance had dropped to 72%. The transportation director knew something had to change — but didn't know where to start. They hired a fleet optimization consultant who spent three months analyzing their operation. The findings: 35% of breakdowns were preventable with better PM adherence. 25% of labor hours were wasted searching for parts. 15% of buses were underutilized while others were overworked. The district implemented three changes: digital DVIRs with mandatory defect repair, optimized PM scheduling based on actual usage, and parts inventory with auto-reorder. Within nine months, breakdowns dropped 42%, PM compliance rose to 94%, and annual maintenance spend fell by $1.8 million. School bus optimization isn't about working harder — it's about working smarter with the right systems, data, and workflows. This guide covers proven methods to improve school bus optimization in 2026, reducing operational risk and increasing fleet reliability.
Reduce operational risk. Increase fleet reliability. Lower maintenance costs. Proven workflows for school bus fleets.
Paper DVIRs are the single biggest barrier to school bus optimization. Missing forms, illegible handwriting, unrepaired defects, and no audit trail. Digital DVIRs transform this process. Drivers complete inspections on tablets or phones. Each defect triggers an automatic work order. Mechanics certify repairs with electronic signatures. The system tracks the complete chain: driver report → mechanic repair → driver acknowledgment before next dispatch. Benefits: defect repair time drops from days to hours, no more missing forms, audit-ready records instantly. Digital DVIRs also capture photo documentation of defects — critical for warranty claims and dispute resolution. Implementation requires: mobile devices for drivers (phones or tablets, often already in drivers' possession), driver training (30 minutes), and software that includes school-bus-specific inspection points (stop arms, crossing gates, emergency exits). Districts that implement digital DVIRs see 40-60% reduction in unresolved defects and near-elimination of missing inspection records. The cost is minimal compared to the risk reduction and efficiency gains.
Preventive maintenance compliance is the strongest predictor of fleet reliability. Fleets with 95%+ PM compliance have 60-70% fewer breakdowns than fleets with below 80% compliance. Yet most school bus fleets struggle to maintain high PM compliance due to manual scheduling, missed deadlines, and competing priorities. Optimization requires: automated PM scheduling (based on mileage, engine hours, or calendar intervals), advance alerts (30/60/90 days before PM due), work order generation (auto-create PM work orders at due date), and compliance tracking (real-time dashboard of PM completion percentage). Best-in-class fleets also use condition-based PM triggers (oil analysis, vibration monitoring) to extend intervals safely. The target: 95%+ PM compliance. The result: fewer breakdowns, longer component life, lower operating cost. Districts that achieve 95% PM compliance typically see maintenance cost per mile drop 15-25% within 12 months.
School bus parts inventory is often overlooked in optimization efforts. Yet poor inventory management costs districts thousands in rush shipping, emergency downtime, and dead stock. Optimization requires: usage-based reorder points (min/max levels calculated from actual consumption), barcode scanning for receiving and issuing, auto-reorder for high-volume consumables (filters, fluids, bulbs, wipers), slow-moving part identification (no usage in 12+ months = dead stock, remove from inventory), vendor performance tracking (lead time, fill rate, pricing), and integration with work orders (parts automatically deducted when work order completed). Benefits: inventory carrying cost reduction (20-35%), elimination of rush shipping (saving $10,000-50,000 annually for a 100-bus fleet), reduced mechanic time searching for parts (saving 10-20 hours weekly), and improved PM completion (parts available when needed).
Mechanic labor is a fixed cost. Optimization improves output without adding headcount. Key strategies: digital work orders with parts lists and procedures (reduces diagnostic and repair time 20-30%), mobile access for mechanics (receive work orders, view parts diagrams, document repairs from tablet), scheduled PM windows (dedicate specific hours to PM work, not emergency repairs), mechanic performance tracking (repair times by mechanic, identify training needs), and cross-training (mechanics trained on multiple bus systems, reducing specialist wait times). Fleets implementing these strategies typically achieve 20-40% labor efficiency improvement, equivalent to adding 1-2 mechanics without additional headcount. The result: more PMs completed, faster repairs, lower overtime costs.
School bus optimization requires data, not intuition. Key metrics to track: cost per mile (by bus, by route, over time), PM compliance (by bus, by shop), breakdown frequency (by bus, by component), MTBF (mean time between failures, by bus), MTTR (mean time to repair, by mechanic), parts usage (top 20 parts by cost and quantity), mechanic productivity (work orders completed, hours per repair), and fuel economy (MPG by bus, by driver). Dashboards should answer three questions at a glance: how are we doing overall? Where are the problems? What needs attention right now? Districts that track these metrics weekly make better decisions: which buses to replace, which mechanics need training, which parts to stock, which routes are most efficient.
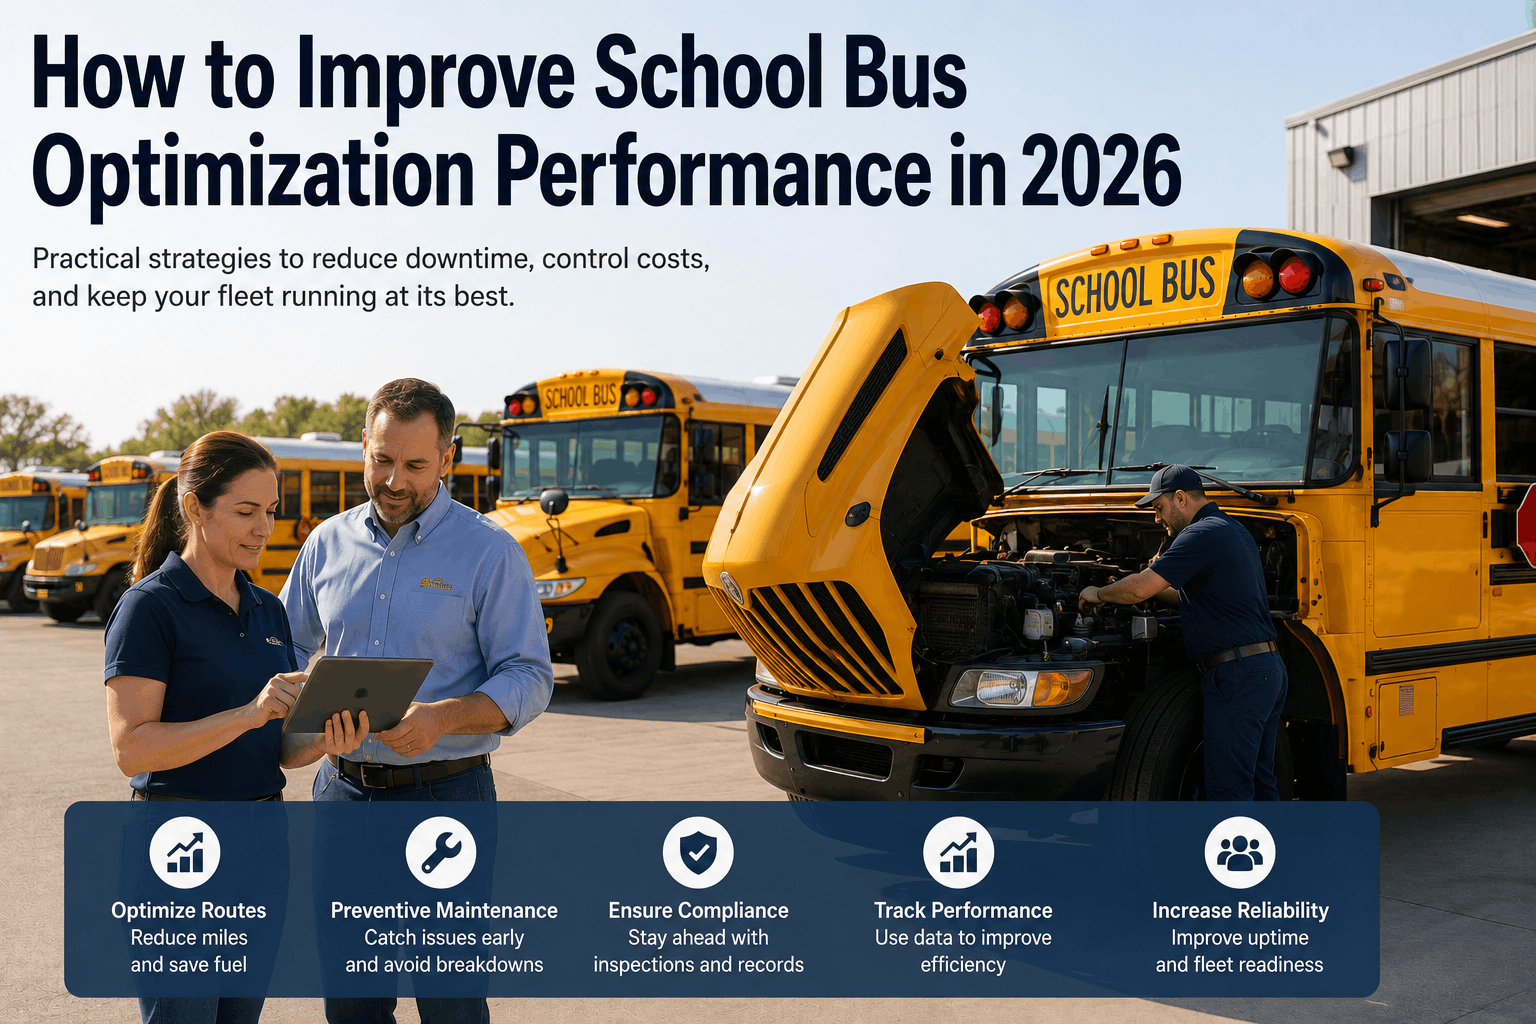
School bus optimization is not about working harder — it's about working smarter with the right systems, data, and workflows. The five pillars: digital DVIRs (foundation of defect management), PM compliance (predictor of reliability), parts inventory (eliminator of downtime), labor efficiency (multiplier of output), and data analytics (driver of decisions). Districts implementing all five typically see 25-40% reduction in maintenance costs, 40-60% reduction in breakdowns, and 90%+ improvement in audit readiness. The investment in optimization pays for itself within 6-12 months. Start with digital DVIRs. Then layer on PM compliance tracking. Then optimize inventory and labor. Finally, build analytics dashboards. The result: lower cost, higher reliability, less risk.
School bus optimization delivers measurable results: 25-40% maintenance cost reduction, 40-60% breakdown reduction, 90%+ audit readiness. The five pillars — digital DVIRs, PM compliance, parts inventory, labor efficiency, and data analytics — work together to transform fleet operations. Start with digital DVIRs (the foundation). Build PM compliance tracking. Optimize parts inventory. Improve labor efficiency. Measure everything with analytics. The investment pays for itself within 6-12 months. Districts that optimize succeed. Districts that don't face rising costs, increasing breakdowns, and audit failures. The choice is clear.