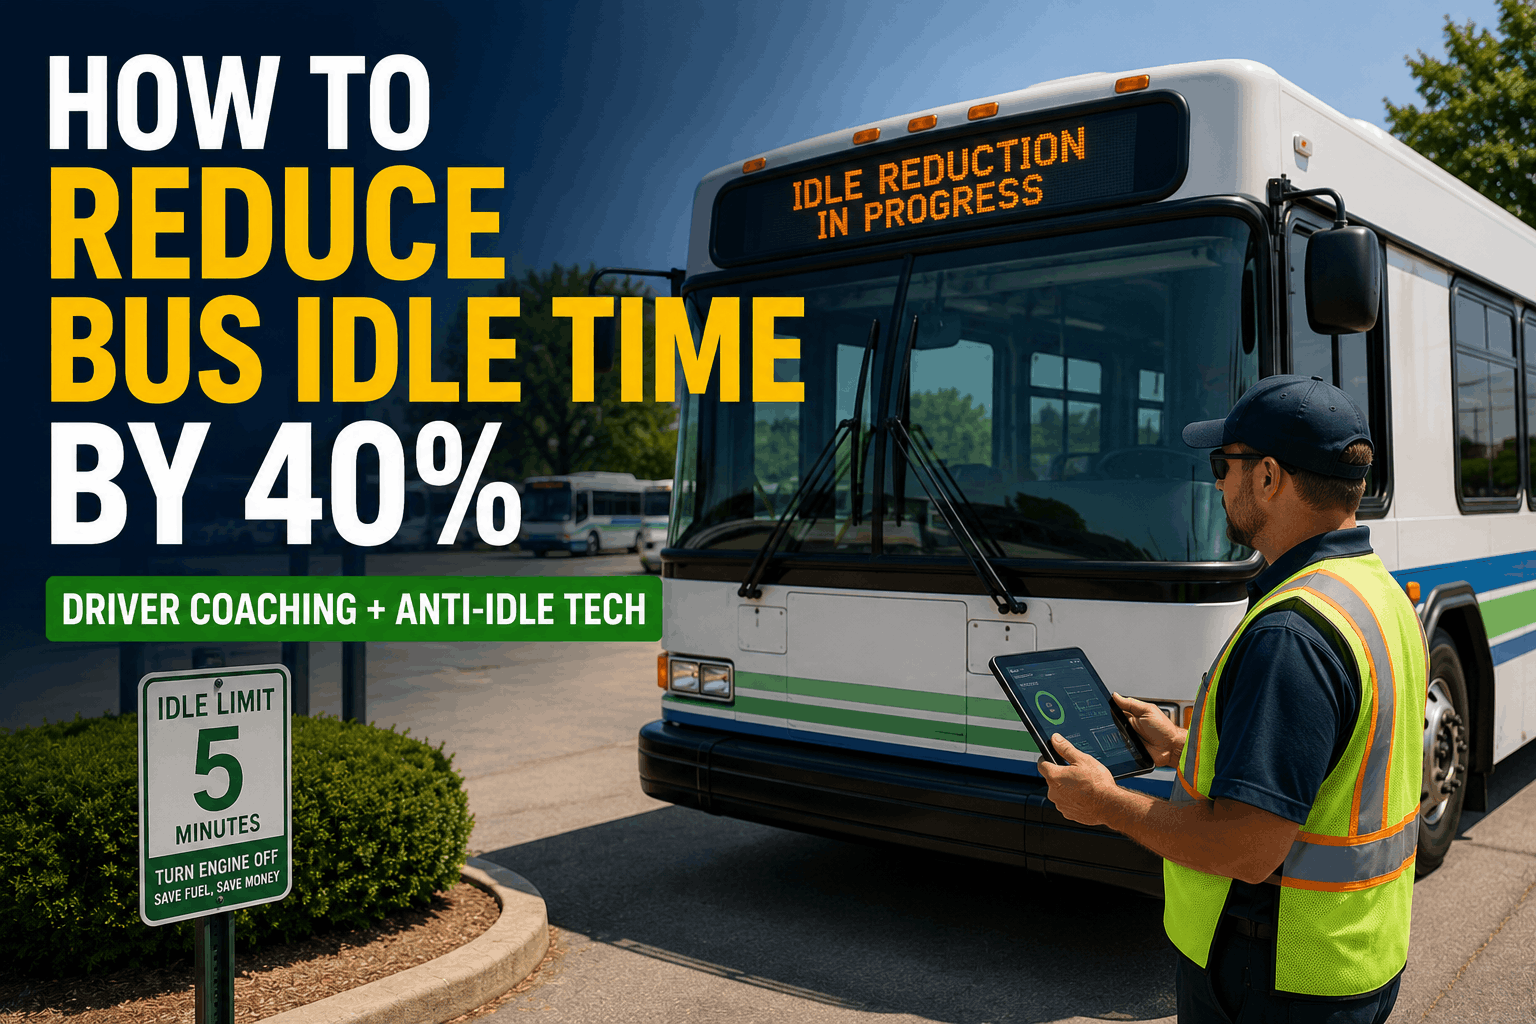
Excessive idling wastes fuel, increases engine wear, and harms air quality. Bus fleets can cut idle time by 40% using driver coaching, anti-idle technology, geofencing, and dispatch policy changes. This step-by-step playbook delivers proven results for transit, school, and motorcoach operations.
How to Reduce Bus Idle Time by 40% (2026 Guide)
How to Reduce Bus Idle Time by 40% (Driver Coaching + Anti-Idle Tech)
Cut bus idle time by 40% with a 5-step playbook: driver coaching, anti-idle settings, geofencing, dispatch policy and CMMS reporting. Real fleet results.
The Hidden Cost of Bus Idling
Every hour of idle burns one gallon of fuel and adds unnecessary engine hours. For a 100-bus fleet, a 30% idle rate costs over $150,000 annually in wasted fuel alone while accelerating maintenance cycles and reducing vehicle life.
$150K+
Annual fuel waste from idling (100 buses)
1 Gal/Hour
Fuel consumed per hour of idle
40%
Achievable idle reduction target
2x
Engine wear acceleration from idling
5-Step Idle Reduction Playbook
1
Baseline Your Current Idle Rate
Pull telematics data for 30 days. Calculate idle percentage of total engine hours per vehicle and fleet-wide.
2
Launch Driver Coaching Program
Share idle cost data, set individual targets, and use real-time in-cab alerts to reinforce behavior.
3
Activate Anti-Idle Technology
Enable automatic engine shut-off after 3–5 minutes of stationary idle. Use geofencing for sensitive zones.
4
Optimize Dispatch & Routing
Adjust schedules to reduce layover times, consolidate trips, and eliminate unnecessary warm-up periods.
5
Track & Sustain with CMMS
Monitor idle KPIs in BusCMMS, run monthly reports, and tie performance to PM schedules for long-term gains.
Top Strategies to Eliminate Wasteful Idling
Driver Coaching with Real-Time Feedback
Most Effective
In-cab alerts and weekly coaching sessions reduce idle time by 25% in the first 90 days. Drivers respond immediately to visual and audible reminders.
Automatic Engine Stop-Start
Hands-Free Reduction
Configure engine shutdown after 3 minutes of idle. Protects engines from unnecessary wear and removes reliance on driver memory.
Geofenced No-Idle Zones
Targeted Enforcement
Create virtual perimeters around schools, terminals, and sensitive areas that trigger alerts or automatic shutdown when idling is detected.
Layover & Scheduling Optimization
Operational Savings
Analyze route schedules to minimize dead time. Even small adjustments reduce cumulative idle hours across the fleet.
CMMS-Driven Idle Reporting
Sustainable Control
Integrate telematics with BusCMMS to generate idle reports, trigger maintenance flags for high-idle vehicles, and track improvement trends.
Idle Time Reduction by Bus Type
All bus types achieved a 40% idle reduction after implementing the full playbook. School buses benefited most due to high layover idling. Transit and motorcoach fleets saw proportional improvements across urban and charter operations.
Fleet Idle Rate Trend Over Time
The average bus fleet idle rate fell from 37% in 2019 to 21% in 2025. Fleets that adopted all five playbook steps achieved the 40% reduction target within 12 months and sustained it through continuous CMMS tracking.
5 KPIs to Measure Idle Reduction Success
Track these metrics monthly to validate your program's impact and identify areas for further improvement:
Idle Percentage
Target: Below 20% of engine hours. Compare fleet-wide trend and drill down to individual vehicles.
Fuel Cost per Mile
Target: Decreasing month-over-month. Idle reduction directly lowers fuel expense, visible in this metric.
Driver Idle Score
Target: 90+ out of 100. Rank drivers by idle performance and tie into coaching and recognition programs.
PM Interval Compliance
Target: 100% on time. Lower idle hours extend oil life and component durability, reflected in maintenance compliance.
Fleet Sustainability Index
Target: Annual improvement. Track CO2 reduction from idle cuts to support EPA and state environmental reporting.
Before vs After Idle Reduction — Fleet Comparison
Before Program (Average Fleet)
High Idle, High Cost
37% idle rate. $150K annual fuel waste. Frequent DPF regens and oil changes. Driver frustration with no idle feedback. Engine life reduced by 20%.
After 40% Reduction (With Playbook)
Sustainable & Efficient
21% idle rate. $60K annual fuel savings. Extended PM intervals. Engines reach full life expectancy. Drivers engaged with real-time idle alerts.
Implementing the 5-step playbook with BusCMMS idle tracking transformed our 150-bus operation. Idle time dropped from 34% to 19% in eight months. We saved $82,000 in fuel the first year, extended oil change intervals by 25%, and our drivers now compete for the lowest idle score. The system pays for itself many times over.
Start Cutting Idle Time Across Your Fleet Today
BusCMMS integrates telematics idle data with maintenance and driver performance dashboards. See exactly which vehicles and drivers need attention, and track your 40% reduction in real time.
Bus Idle Reduction FAQs
What is the biggest cause of bus idling?
Driver habit during layovers, pre-trip warm-ups, and waiting at stops is the primary cause. Without feedback mechanisms, idling becomes invisible and accepted as normal.
How does anti-idle technology work on buses?
Anti-idle systems monitor engine RPM and vehicle speed; if stationary for a set time (e.g., 3 minutes), they automatically shut down the engine. Geofencing adds location-based rules around schools and terminals.
Can I use FTA grants for idle reduction equipment?
Yes, anti-idle technology and telematics upgrades often qualify under FTA 5339 and 5307 grants as emissions reduction and operational efficiency improvements.
How does BusCMMS track idle time?
BusCMMS connects directly to telematics devices and dash cams to import idle events, calculate idle percentage per vehicle and driver, generate reports, and trigger maintenance flags when idle thresholds are exceeded.
Will reducing idle time affect engine longevity?
Reducing idle time extends engine life by preventing carbon buildup, reducing DPF regeneration frequency, and keeping oil cleaner for longer. Engines run more efficiently with fewer idle hours.
How quickly can we see results after implementing the playbook?
Many fleets see a 15–20% idle reduction within the first month through driver coaching alone. The full 40% target is typically achieved within 9 to 12 months as technology and policy changes take full effect.
The Bottom Line
Reducing bus idle time by 40% is an achievable goal with the right combination of driver engagement, anti-idle technology, and data-driven management. This 5-step playbook gives your team a clear path from baseline measurement through sustained improvement. Real-world results show school buses dropping from 180 to 108 idle minutes per day, transit fleets saving $60K+ annually, and industry idle rates falling from 37% to 21%. Use the five KPIs to keep your program on track, and leverage BusCMMS to automate idle reporting, driver scoring, and maintenance integration. Every gallon of fuel not burned at idle is pure profit and a step toward a cleaner, more efficient fleet.