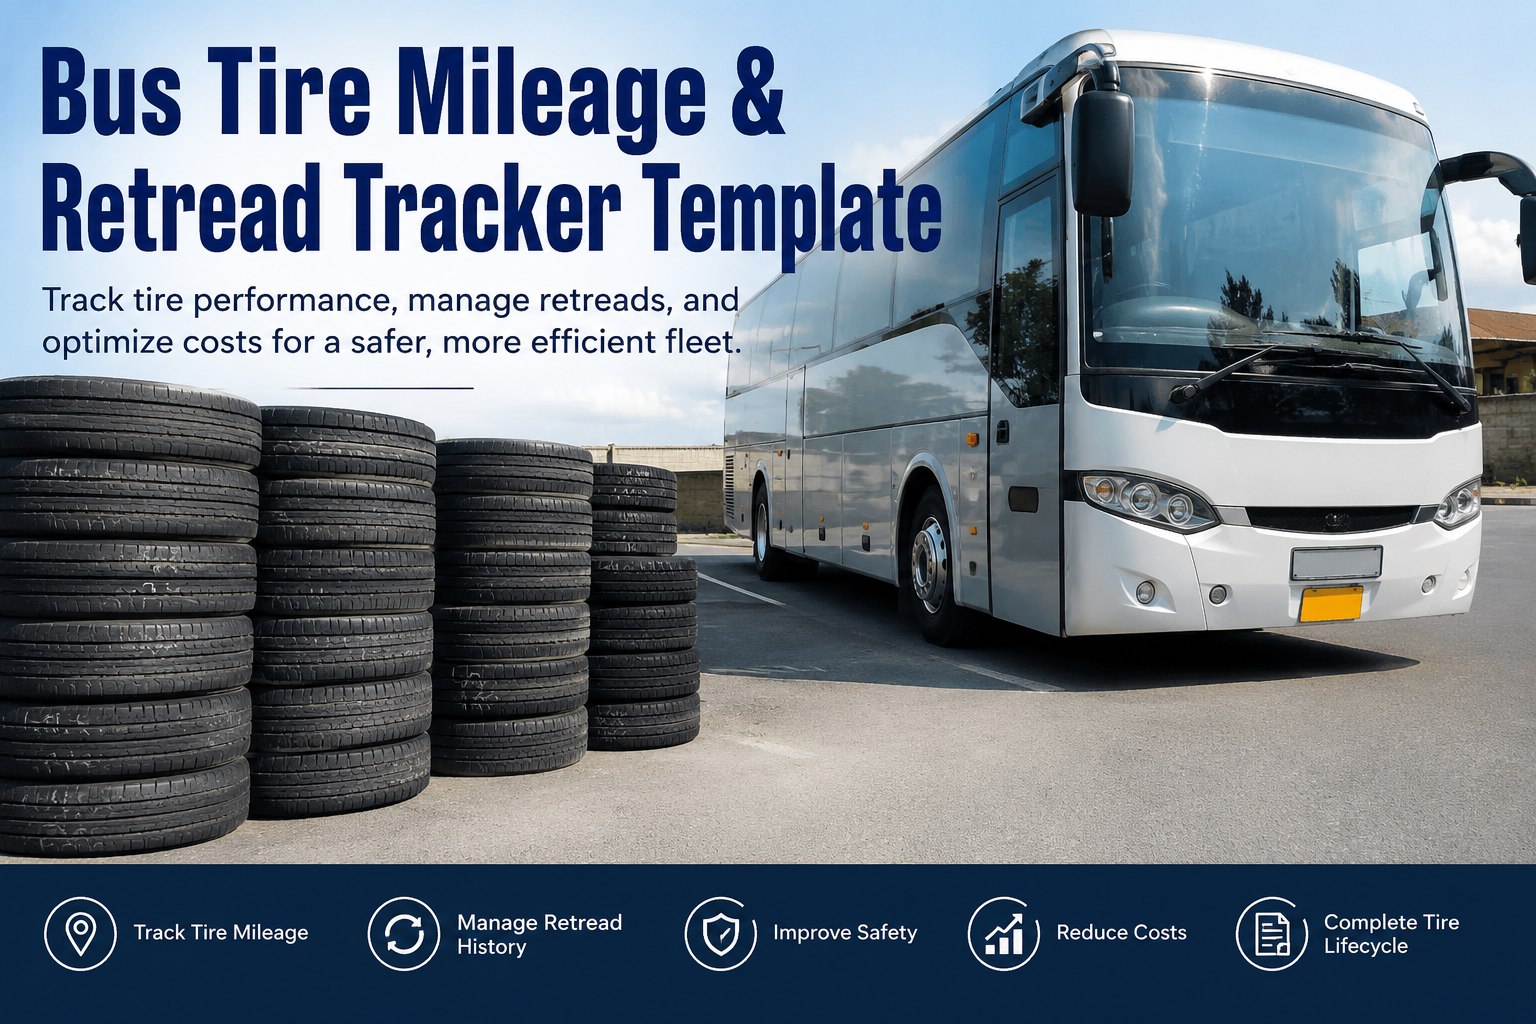
You walk into the shop on a Monday morning and there is a pile of scrapped bus tires against the back wall. Fifteen, maybe eighteen tires. You count them and do the math nobody in the shop wants to do: at least half of those casings were retreadable. They got pulled at four thirty-seconds of tread when the retread program allows a pull at two thirty-seconds, and now none of them are going to a second life. Every one of those casings represents roughly $180 in avoidable cost, plus the value of two more retread lives those casings will never see. For a bus fleet running six tires per bus across even twenty buses, this pile shows up four times a year and by year end the fleet has quietly paid for tires it never should have needed to buy. This is the problem a proper bus tire mileage & retread tracker template solves — not by making tires last longer, but by making sure no casing gets thrown away before its second and third life.
Bus Tire Mileage & Retread Tracker Template: The 20-Field Casing Lifecycle Framework
A complete tire tracking framework covering identity, lifecycle events, retread history, and cost per mile — so no casing gets pulled early, no retreadable tire gets scrapped, and every dollar per mile is traceable back to the bus, position, and vendor that produced it.
- 20 fieldsacross 4 zones
- 3-life casing1 new + 2 retreads
- 10–15%of fleet ops budget
- 60–70%retread vs new savings
Tire lifecycle, retread tracking, and cost-per-mile analytics on one platform
-
01New Tire$600 32/32"105,000 mi · Life 1 -
02Retread 1$220 22/32"68,000 mi · Life 2 -
03Retread 2$220 12/32"42,000 mi · Life 3 -
04Pull · Scrap— 4/32"Legal minimum reached
What Untracked Bus Tires Actually Cost a Fleet
Tire costs consume 10 to 15 percent of a commercial fleet’s total operating budget. On a bus fleet, that lands somewhere between fifteen and thirty thousand dollars per bus per year in tire-related spend once you count new purchases, retreads, mounting, and roadside tire calls. The difference between a well-tracked tire program and a paper-based, memory-driven one is not marginal. It is the difference between the fleet with a $0.030-per-mile cost basis and the fleet paying $0.045 per mile for the same miles driven.
-
$180
Avoidable Cost per Casing
Every tire pulled at 4/32" instead of 2/32" gives up its retread eligibility. Multiplied across the fleet, this is where budgets quietly leak.
-
$54,000
Year-One Savings Documented
A 95-vehicle fleet documented $54,000 in first-year savings after implementing structured tire lifecycle tracking — purely from retread capture.
-
5×
Lifecycle Mileage Uplift
A premium tire plus two retreads delivers up to five times the mileage of a single-life cheap tire — but only if the retread lives get captured.
Every one of those numbers is unlocked by the same thing: knowing which casing is on which bus, in which position, with what history. That is what the tracker template below is designed to capture. Book a demo to see how BusCMMS tracks casing lifecycle and cost per mile across a mixed fleet.
The 3-Life Bus Tire Casing Journey
A single bus tire is not one asset. It is a casing that lives three lives — a new tire, then a first retread, then a second retread — before its structural integrity retires it from service. The economics only work when the tracker captures every phase transition and pulls each tire at the correct tread depth for the next retread cycle to succeed.
-
01
New Tire · Life 1
Purchased new, mounted, deployed to a specific bus and position. Runs 90,000 to 130,000 miles depending on position and tire spec. Cost: $400–$600.
Full tread: 32/32" -
02
Retread 1 · Life 2
Pull at correct tread depth (steer 4/32", drive/tag 2–4/32"), casing sent to retreader. New tread applied to the same casing. Runs another 60,000 to 90,000 miles. Cost: $175–$280.
Restored tread: 22/32" -
03
Retread 2 · Life 3
Second retread on the same casing. Runs 40,000 to 70,000 miles. Cost same as first retread. This is where the total lifecycle CPM drops sharply below the new-tire-only alternative.
Restored tread: 12/32" -
04
Scrap · End of Life
Casing integrity exhausted. Total lifetime miles: 190,000 to 290,000+ per casing. Total cost: $750–$1,160 across all three lives.
Legal minimum: 4/32"
Miss a phase and the whole equation collapses. Pull a steer tire at 4/32" when it should have gone to a drive position first at that depth, and you burn a life. Pull too late at 2/32" on a casing that needed 4/32" for a proper retread, and you burn the casing. The tracker below prevents both. Book a demo to see how BusCMMS flags pull points before casings get burned.
The Complete 20-Field Bus Tire Mileage & Retread Tracker
Twenty fields, four zones, every casing tracked from purchase to scrap. Adopt this as-is or map it into your existing CMMS — what matters is that every field gets captured every time.
Tire Identity
- 01Casing ID / DOT CodeUnique identifier tied to the physical casing
- 02PositionSteer L/R, Drive #1-4, Tag, Spare
- 03Assigned BusFleet identifier for the current host bus
- 04Manufacturer / ModelBrand, spec code, retreader mold if applicable
- 05StatusNew / Retread 1 / Retread 2 / Scrap
Lifecycle Events
- 06Install Date + OdometerWhen mounted and starting mileage
- 07Removal Date + OdometerWhen pulled and ending mileage
- 08Miles This LifeAuto-calc: removal minus install odometer
- 09Pull Tread Depth32nds of an inch at removal
- 10Removal ReasonWear / damage / retreadable / scrap
Retread History
- 11Retread #1st or 2nd retread on this casing
- 12Retread DateWhen the casing returned from retreader
- 13Retreader / VendorName, contact, quality rating
- 14Post-Retread TreadRestored depth after retread
- 15Retread CostPer-event cost, added to cumulative total
Cost & Performance
- 16Original New CostLife 1 purchase price
- 17Cumulative CostOriginal + retread costs to date
- 18Total Lifetime MilesSum across all lives
- 19Cost Per MileCumulative cost divided by lifetime miles
- 20Final DispositionRetained casing value or scrapped
The template is universal — it fits school district fleets, transit agencies, and charter operators equally. Every zone maps to a lifecycle stage, and Zone D pulls everything together into the number that actually matters: cost per mile per position. Book a demo to see the 20-field tracker pre-loaded into a live fleet dashboard.
What Each Tire Position Actually Tells You
Position determines everything about how a tire wears and how long it lasts. A tracker that lumps all tires together misses the entire story. Here is how each position behaves in a typical school bus or transit fleet.
-
Steer
Highest cost per position — the tire the driver actually steers with. Sensitive to alignment and inflation. Pull at 4/32" to preserve retread eligibility.
90–130Kmi Life 1 4/32"Pull point -
Drive
Highest torque and braking load. Wear pattern reveals overload, driver behavior, and mechanical issues. Retreads exceptionally well when tracked carefully.
80–110Kmi Life 1 2–4/32"Pull point -
Tag / Trailer
Even wear, lowest cost position. Best position to place a retread casing that still has good structure but is not premium enough for steer duty.
100–140Kmi Life 1 2–4/32"Pull point -
Spare / Rotation
Sits until deployed. Tracker prevents forgotten spares from aging out. Rotation logic keeps casings productive across positions before scrap.
Variableon deploy Age <7yrDOT limit
Tracking wear pattern by position also surfaces the invisible problems that destroy casings prematurely. Shoulder wear on drive tires reveals under-inflation. Cupping on any position reveals bad shocks. Feathering reveals alignment. All three surface in a well-kept tracker before the casing is beyond retread. Book a demo to see per-position wear analytics on a live fleet.
Cost Per Mile: What the Numbers Actually Show
Cost per mile is the single number that separates fleets who think they know their tire economics from fleets who actually do. Below is the real math for a single tire position over its full lifecycle, comparing the two approaches every bus fleet defaults into.
- New tire 1$600
- New tire 2$600
- New tire 3$600
- 3-life total$1,800
- Miles covered~315,000
- New tire (Life 1)$600
- Retread 1 (Life 2)$220
- Retread 2 (Life 3)$220
- 3-life total$1,040
- Miles covered~215,000
Fleet-wide potential savings from proper casing lifecycle tracking — realized only when every retread life gets captured.
Those numbers are not hypothetical. A 95-vehicle fleet documented $54,000 in first-year savings just from retread capture after implementing structured tracking. The savings compound in year two and three as more casings hit their second and third lives. Book a demo to see fleet-wide tire cost analytics on real data.
How BusCMMS Handles Tire Lifecycle Tracking
A tracker template on paper is a starting point. A tracker built into the same system that runs your PM schedules, DVIRs, and work orders is what actually produces the savings. Book a demo to see how BusCMMS ties tire tracking to the rest of your fleet workflow.
Casing ID Tracking
Every casing tagged and tracked from purchase through every retread cycle to scrap.
Pull Point Alerts
Alerts fire before tread hits pull threshold · no casings get burned by late removal.
CPM Analytics
Cost per mile calculated per casing, position, bus, and vendor · real ROI visibility.
Retreader Scorecards
Track which retread vendors deliver the best post-retread mileage · negotiate on data.
Rotation Scheduling
Auto-schedule position rotations based on mileage or tread depth · even wear across positions.
Wear Pattern Diagnostics
Shoulder, cupping, feathering flagged automatically · catches alignment and inflation issues early.
BusCMMS reports fleets on its platform typically capture 90%+ of retread-eligible casings and lower tire-related cost per mile by 15-25% within the first year — BusCMMS’s own reported figures from bus-fleet customers running the platform in production.
What is a bus tire mileage & retread tracker template and what does it capture?
A bus tire mileage & retread tracker template is a structured record that follows a single tire casing through its full three-life journey — from new purchase, through first and second retreads, to final scrap. It captures 20 fields across four zones: tire identity (casing ID, position, host bus), lifecycle events (install and removal dates and odometers, pull tread depth), retread history (which retread, vendor, cost, post-retread depth), and cost analytics (cumulative cost, total miles, cost per mile). This gives fleets the data to identify which casings, positions, and vendors deliver the best cost per mile.
How many times can a bus tire casing actually be retreaded?
A quality bus tire casing can typically be retreaded 2-3 times before its structural integrity retires it from service. The key variable is pulling the tire at the correct tread depth (steer at 4/32", drive and trailer at 2-4/32") so the casing arrives at the retreader with enough structure remaining to accept a new tread. Pulling too late damages the casing and terminates the retread lifecycle prematurely, which is where most of the avoidable cost in fleet tire programs sits.
How much does a bus tire retread cost compared to a new tire?
Retreads typically cost 30-50% less than a new tire — some quality retread programs deliver 60-70% savings vs new. On typical premium bus tire pricing of $400-$600, that puts retread costs in the $175-$280 range. The important metric is not the unit price but the total lifecycle cost per mile: a $540 premium tire with two $220 retreads across 200,000+ miles delivers a cost per mile roughly 15-25% lower than a comparable new-tire-only strategy.
What is the difference between pull point and legal minimum tread depth?
The legal minimum tread depth is 2/32" on drive and trailer positions and 4/32" on steer positions per federal DOT rules. The pull point is the tread depth at which you should remove the tire from service to preserve retread eligibility. Steer tires are usually pulled at 4/32", drive and trailer at 2-4/32". Running a tire to the legal minimum leaves no buffer for retread — the casing arrives at the retreader with insufficient structure and often cannot be retreaded, which forfeits the second and third life value.
How does a digital tracker improve tire management vs paper?
A digital tracker eliminates the four scenarios that cost fleets the most: forgotten casings sitting in the tire room aging past DOT limits, tires pulled at the wrong tread depth, retread lives that never get logged so cost per mile stays a guess, and vendor performance that never gets scored. A properly built digital tracker fires alerts at pull points, auto-calculates cost per mile per position, and produces retread-vendor performance reports that surface which supplier is actually delivering value. Fleets using structured tracking systems typically lower tire-related cost per mile by 15-25% within the first year.