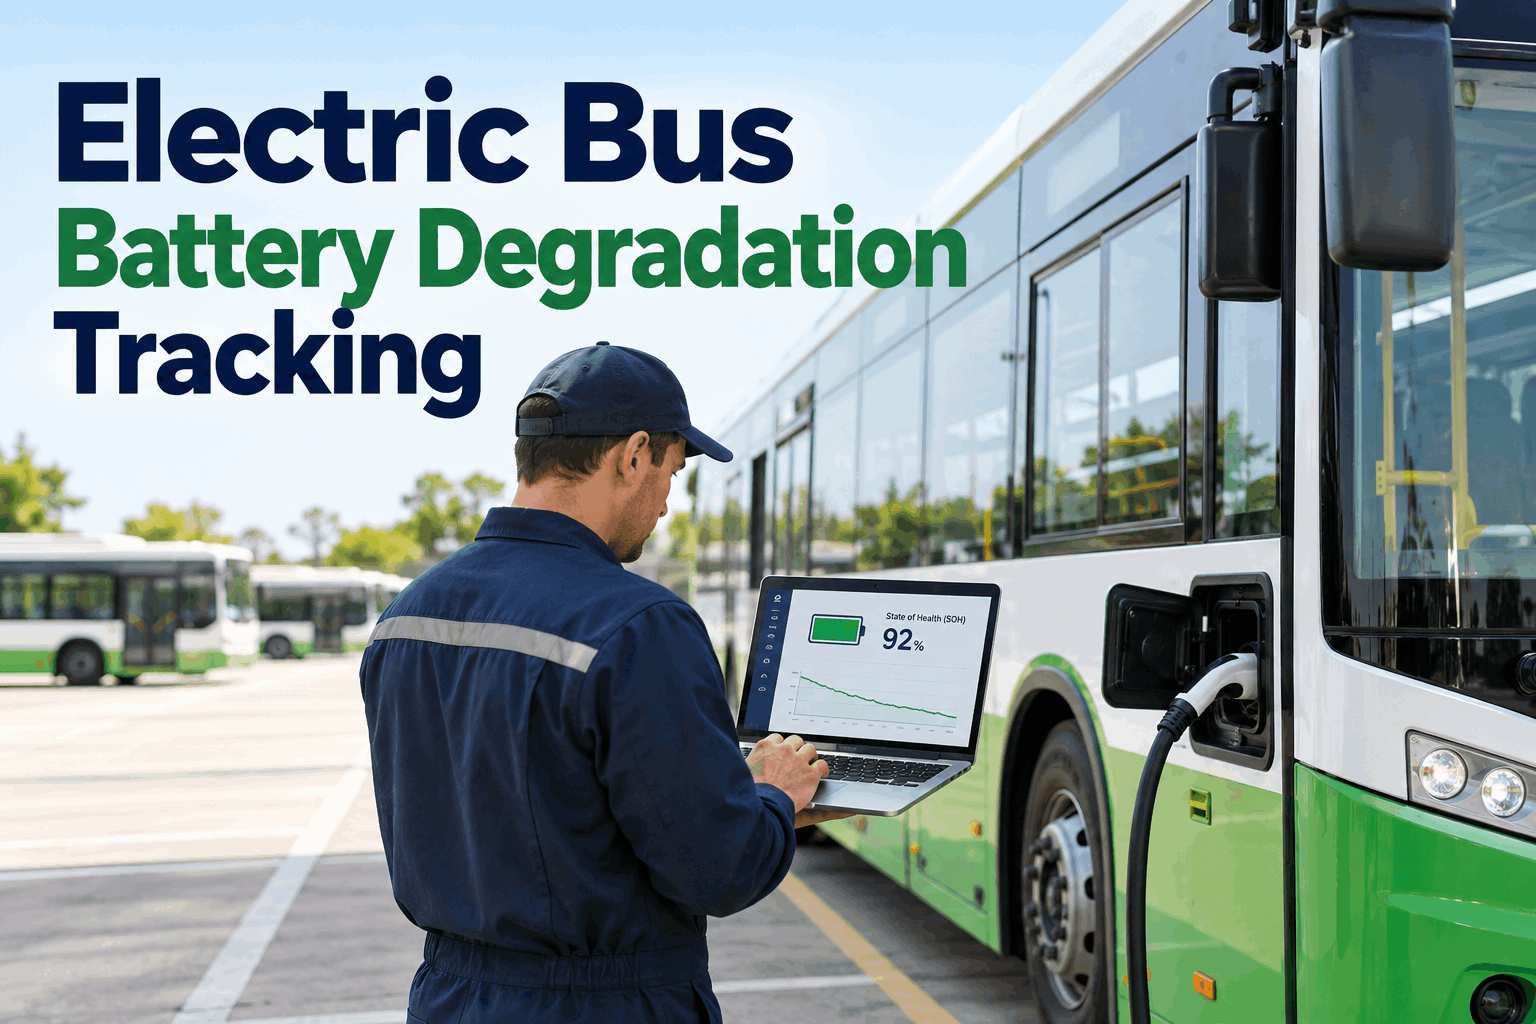
Two of your electric buses are the same age and ran the same routes — but one quietly dropped to 74% battery health while the other is still at 89%. You find out the hard way when it comes up short on a cold afternoon. Degradation is not uniform, and not visible unless you track it. You can see how tracking battery health per bus catches the fading one first.
Electric Bus Battery Degradation Tracking: Watch State of Health by the Unit
Every EV battery loses capacity over time — and it does not happen in a straight line. State of health fades slowly for years, then accelerates through a knee point where range falls off fast. Track it per bus and you see the drop coming; ignore it and the first warning is a bus that cannot finish its route.
Why Battery Degradation Is Never Uniform Across a Fleet
Buy five electric buses the same day and they will not age the same way. The one on the hilly express route burns more energy per mile; the one that gets plugged into the fast charger every turnaround takes more heat; the one left at full charge over the weekend loses a little more to calendar aging. Same fleet, same age — very different state of health. A single fleet-wide assumption hides exactly the bus you need to watch.
Bus 09 is the one that strands a route — and on a fleet-average view it is invisible, pulling the number down a point or two while quietly sitting below the replacement line. Tracking state of health per unit is what surfaces it before a driver does. You can start free and see every bus's battery health at a glance.
What Speeds Up Battery Degradation — and What You Can Control
Some capacity fade is just time: calendar aging happens no matter what. The rest is usage, and usage is where a fleet actually has levers. Heat, deep discharges, constant fast-charging, and heavy energy throughput all push a battery down the curve faster — and all of them show up in the data if you are watching.
High temperatures — from climate, from fast charging, from heavy loads — are among the biggest accelerators of capacity fade.
Repeated ultra-fast charging of the same bus adds heat and stress. Rotating which bus takes the fast charger spreads the wear.
Running a pack to empty and charging to 100% and holding it there both age it faster than staying in the 10–90% band.
The more energy pushed through the pack, the faster it ages — which is why driving style and route load matter to battery life.
The point is not to baby the batteries into uselessness — it is that these factors are measurable, so you can see which buses are being worked hardest and rotate before the damage is done. That is route allocation driven by data instead of habit. You can book a demo and see degradation drivers tracked per bus.
How BusCMMS Tracks Electric Bus Battery Health
Tracking degradation is not about reading one number once — it is about watching the trend for every bus so the fade is a plan, not a surprise. Four things make that work.
SOH tracked per bus over time
State of health and energy data flow in from your telematics, so every bus carries its own health history — not a fleet average that hides the weak pack.
Trend lines, not one-off readings
You watch each pack's curve, so a bus approaching the knee point is flagged while there is still time to react — reassign it, not replace it in a panic.
Match routes to real capacity
A bus at 76% does not belong on your longest route. Tracking health lets you assign the fading buses to shorter runs and protect fleet availability.
Plan replacements and warranty
When a pack trends toward 70%, you plan the replacement on your schedule and against the warranty window — a budgeted project, not an emergency.
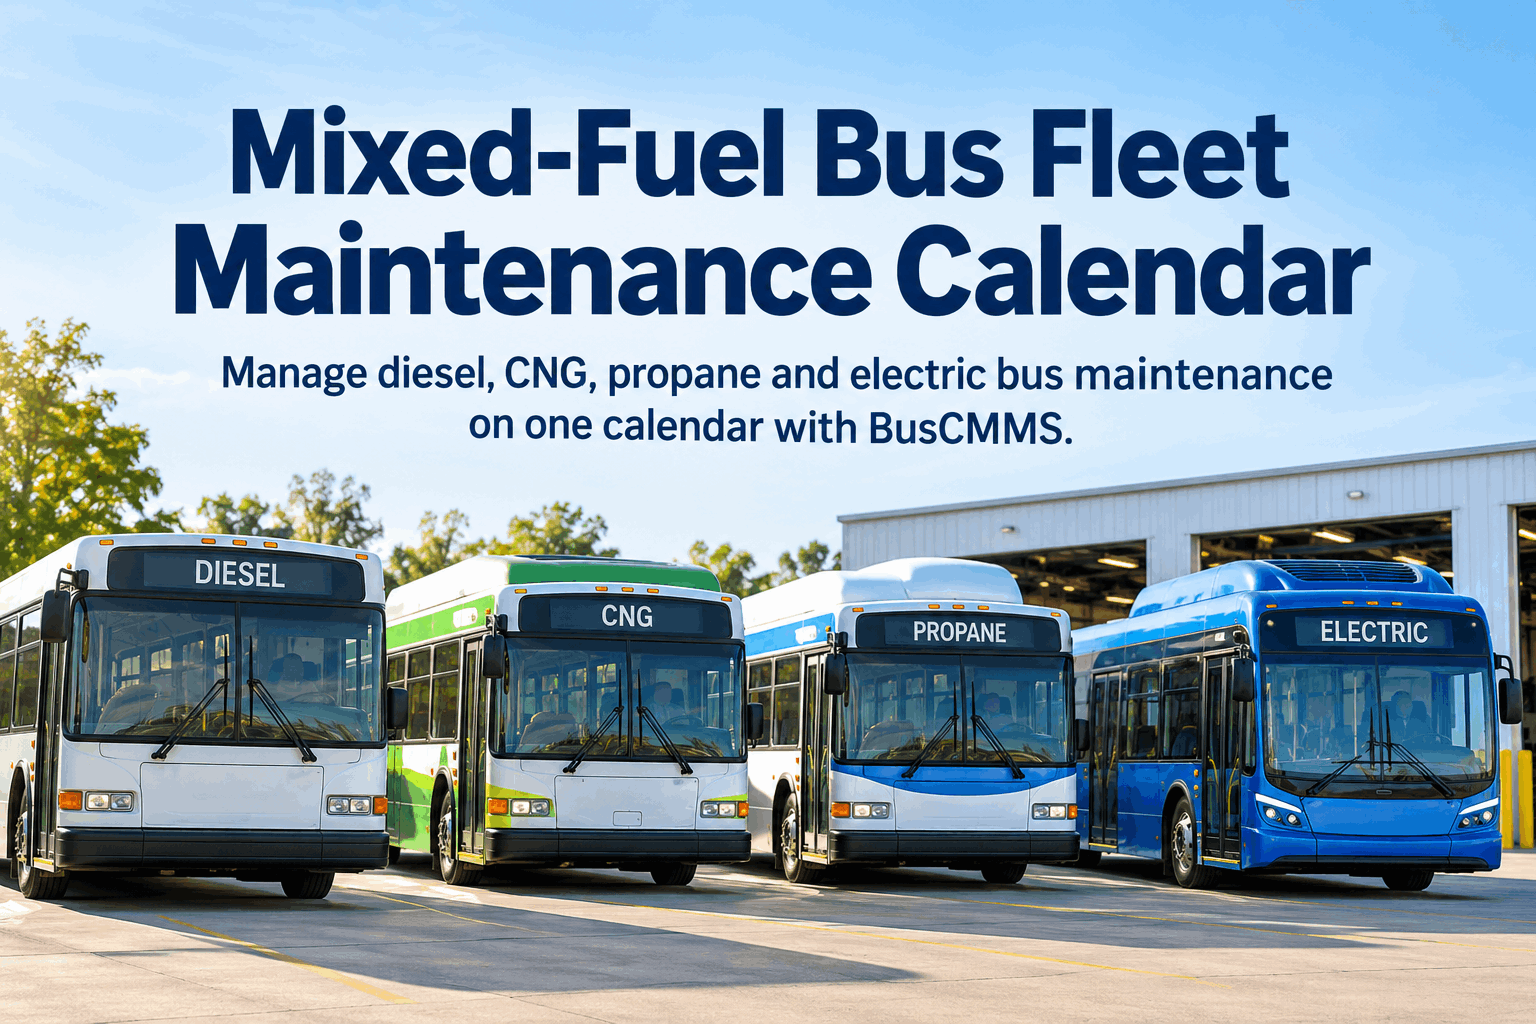
That turns battery degradation from the scariest unknown in an EV fleet into just another thing you manage — the same way a bus-specific CMMS already handles diesel, CNG, and propane. It is worth seeing on your own buses in a short walkthrough of battery health tracking.
For the first two years we treated the batteries like they were all fine, because on paper the fleet average looked great. Then one bus started coming back low and we realized we had no idea which packs were actually degrading. Once we started tracking state of health per bus, we moved two fading ones to short routes and got another full season out of them. You cannot manage what you are not measuring, and battery health is the thing to measure.
Electric Bus Battery Degradation: The Short Version
Degradation is non-linear
State of health fades slowly for years, then accelerates through a knee point where range drops fast.
It is uneven across the fleet
Same-age buses can sit 15 points apart in SOH — a fleet average hides the one that strands a route.
Usage drives what time does not
Heat, fast charging, deep discharge, and throughput all speed the fade — and all are measurable.
Tracking per bus turns it into a plan
Watch each pack's trend, reassign the fading ones, and budget replacements before the knee point.
Battery degradation is the one certainty of running an electric fleet — but a stranded bus is not. The difference is whether you can see each pack's state of health long before it crosses the line. Track it per unit, let the data drive route allocation and replacement planning, and the batteries fade on your schedule instead of surprising you on a route. You can start free and put every battery's health on one screen.
Electric Bus Battery Health: Common Questions
What is electric bus battery state of health (SOH)?
State of health is how much energy a battery can store now compared to when it was new, expressed as a percentage. A pack at 100% SOH holds its full original capacity; at 80% it holds four-fifths. SOH is the core measure of battery degradation, because it directly determines how much usable range a bus has left. Tracking it per bus over time is how you see a pack fading before it affects a route.
At what state of health does an electric bus battery need replacing?
In the bus sector, a battery is generally considered due for replacement once it drops below about 70% state of health. Degradation is non-linear: a pack fades gently for years, then hits a knee point where decline accelerates, so by the time it approaches 70% the usable range is falling fast. Because most electric buses run long enough to reach that point, most will need at least one battery replacement over their service life — which is exactly why planning for it beats being surprised by it.
What causes electric bus batteries to degrade faster?
Two forces: calendar aging, which happens simply with time, and usage, which the fleet can influence. The usage factors that accelerate fade are heat, high depth of discharge, frequent fast charging, and heavy energy throughput. Batteries are happiest operating in roughly the 10% to 90% state-of-charge band and at moderate temperatures. Running a pack to empty, holding it at a full 100%, or repeatedly fast-charging the same bus all push it down the curve faster than necessary.
How does battery degradation affect electric bus range?
Directly and proportionally. A bus at 80% state of health has roughly 80% of its original usable range, before you even account for cold weather or terrain. Because degradation accelerates near the knee point, a bus that lost only a little range in its early years can lose it quickly later — which is how a route a bus handled comfortably becomes a route it cannot finish. Tracking SOH lets you match each bus to a route it can still complete and reassign the fading ones early.
How does BusCMMS track electric bus battery degradation?
BusCMMS pulls state-of-health and energy data from your telematics and tracks it per bus over time, so each pack has its own trend line rather than disappearing into a fleet average. You can see which buses are fading fastest, flag ones approaching the replacement threshold, match routes to each bus's real remaining capacity, and plan replacements against the warranty window. It keeps electric buses on the same dashboard as your diesel, CNG, and propane fleet, so battery health is managed alongside everything else.