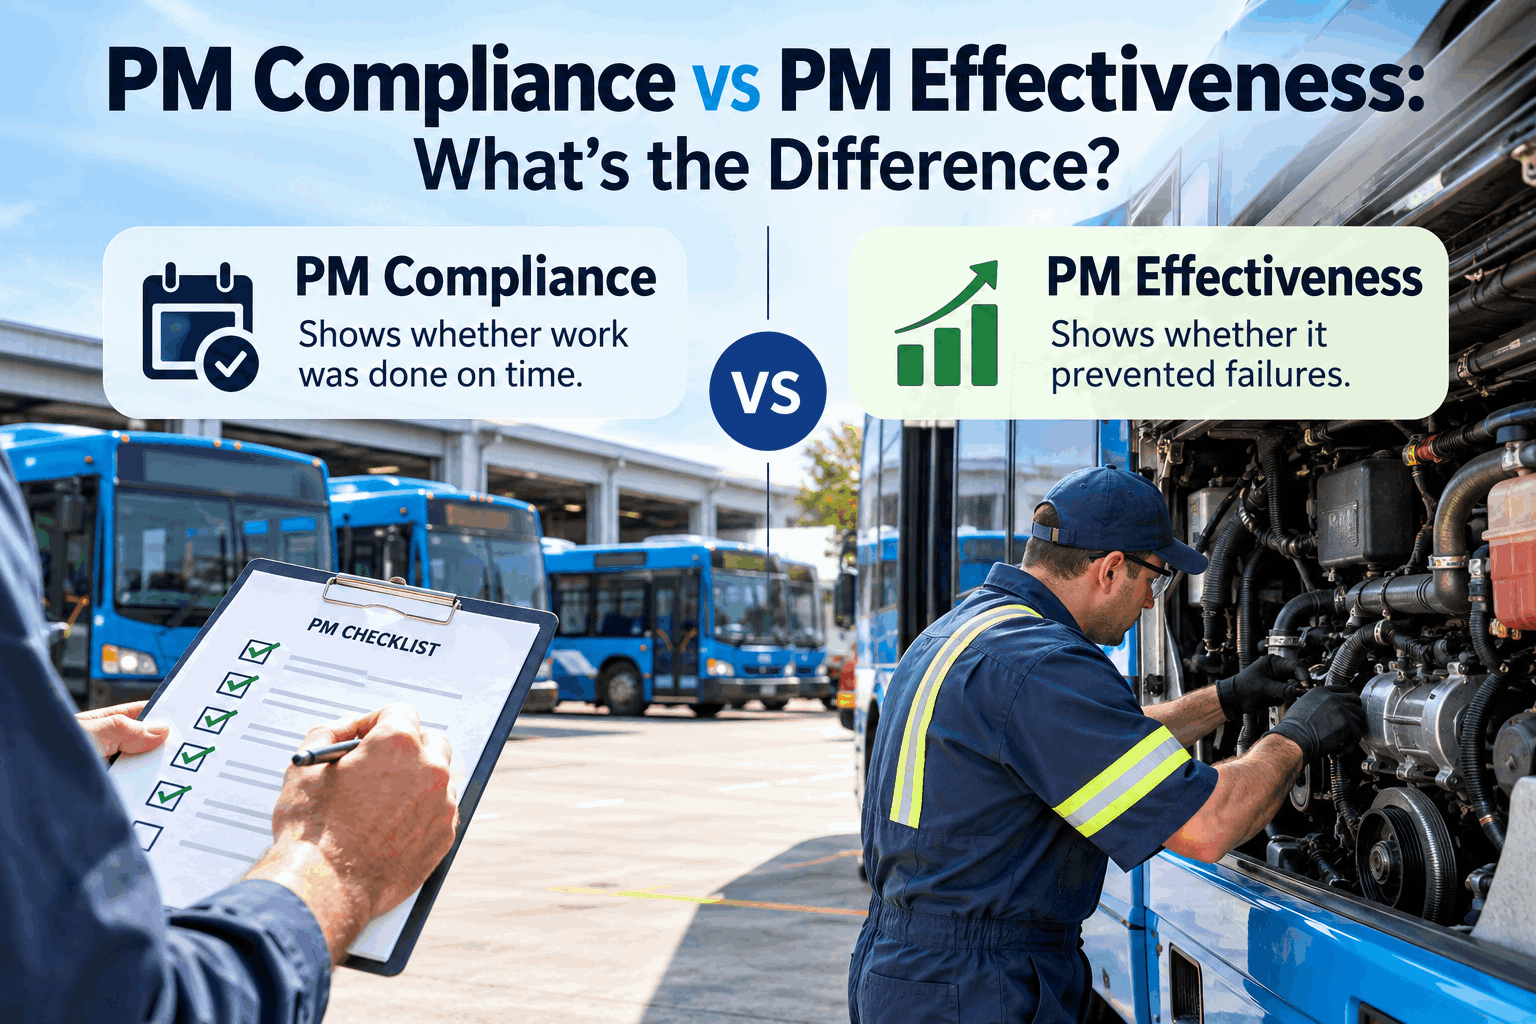
Your PM compliance report is green — 98% of scheduled services done on time. Then a transmission lets go on Route 12 during the morning run, and it's a bus that was serviced three weeks ago. That gap is the whole point of PM compliance vs effectiveness: compliance tells you the work got done, effectiveness tells you whether it actually prevented the failure. They are not the same number, and a fleet can ace one while failing the other.
PM Compliance vs PM Effectiveness: What's the Difference?
One says the service was done on time. The other says it kept the bus off the shoulder. High compliance can quietly hide low effectiveness — here's how to see both.
PM Compliance vs Effectiveness, Defined Side by Side
These two metrics get used interchangeably, and that's exactly how a fleet ends up with a spotless compliance record and a road-call problem it can't explain. They measure two completely different things. Here's the clean distinction.
PM Compliance
"Did we do the scheduled work on time?"
- Measures on-time completion of scheduled PMs
- A process metric — did the task happen
- Easy to hit 95-100% and look good
- Often required for FMCSA and state DOT records
- Says nothing about whether the PM worked
PM Effectiveness
"Did the work actually prevent failures?"
- Measures whether PM reduced unplanned failures
- An outcome metric — did the task work
- Shows up in road calls, MTBF, and cost per mile
- Harder to measure — needs failure analysis
- The number that actually protects your routes
The simplest way to hold the difference: compliance is about the calendar, effectiveness is about the outcome. A checkbox says the oil got changed on schedule; only a failure analysis tells you whether the PM interval, scope, and quality were right enough to keep that bus running. If you only track one, you're flying half-blind — and most fleets track only compliance because it's the easy one to pull. For the full metric set that sits around these two, our bus fleet KPI dashboard guide lays out the dashboard view. Book a demo to see compliance and effectiveness side by side on one screen.
Why 98% PM Compliance Can Still Mean Low Effectiveness
Here's the uncomfortable part: you can do every PM on time and still not prevent the failures. High compliance with low effectiveness is a real, common state — and these are the four ways it happens.
Wrong Interval
The PM is on schedule, but the schedule is wrong. A component that fails at 18,000 miles won't be saved by a 24,000-mile service, no matter how on-time it is.
Wrong Scope
The checklist doesn't cover the thing that's actually failing. The PM inspects everything except the part that keeps stranding buses on the route.
Rushed or Pencil-Whipped
The PM was logged as complete but done in a hurry — a driver shortage or a backlog means the box gets checked without the depth. Compliant on paper, hollow in practice.
No Feedback Loop
Failures happen and nobody feeds them back into the PM program. The same component fails on bus after bus because the schedule never gets adjusted from what actually broke.
Notice that all four are invisible to a compliance report. Every one of these buses shows up green — PM done, on time, checked. The failure only surfaces when you look at the outcome side: are these serviced buses still breaking down, and on what? That's the question compliance can't answer and effectiveness is built to. Reducing road calls is exactly where this bites, which is why our breakdown-prevention strategies lean on the effectiveness side, not the compliance side. Sign up free and start correlating failures against PM history.
How to Actually Measure PM Effectiveness
Compliance is a single easy percentage. Effectiveness is read from a handful of outcome signals — the numbers that tell you whether the PM program is doing its job. These four are the ones that matter for a bus fleet.
MTBF Trend
Mean time between failures, trended over time. If PM is effective, the average distance or days between unplanned failures should be climbing, not flat or falling. The trend matters more than the single number.
Road-Call Rate
Unplanned failures on active routes, per bus or per 100,000 miles. This is effectiveness in its rawest form — every road call is a PM that didn't prevent what it was supposed to.
PM-to-Failure Correlation
The sharpest signal: did a failure occur on a component that was recently serviced? A cluster of failures right after a PM points to scope, quality, or interval problems in that specific service.
Cost Per Mile Trend
Effective PM should bend maintenance cost per mile down over time by trading expensive emergency repairs for cheaper planned work. A rising trend on a compliant fleet is an effectiveness warning.
The reason these are harder than compliance is that they require connecting failures back to PM history — which means your work orders, PM records, and failure events all have to live in one system that can correlate them. A compliance percentage you can pull from a calendar; effectiveness you can only read from the relationship between what you serviced and what still broke. For the mechanics of the reliability numbers themselves, our MTBF calculation and benchmark guide walks through the math. Book a walkthrough to see PM-to-failure correlation on a real fleet.
Closing the Gap: Tuning PM From What Actually Fails
Measuring effectiveness is only useful if it changes the PM program. The whole point is a feedback loop: the failures you see should reshape the schedule you run. Here's the tuning logic that turns effectiveness data into a better PM program.
This loop is what separates a static PM program from one that gets better every quarter. A fleet that only tracks compliance never runs this loop — it keeps doing the same PMs on the same schedule while the same failures keep happening. A fleet that tracks effectiveness treats the schedule as something to tune against reality, and that's where the road-call rate actually starts to fall. Our guide to PM optimization best practices goes deeper on the tuning side. Sign up free and start tuning your PM program from real failure data.
How BusCMMS Measures Both Compliance and Effectiveness
Because BusCMMS holds the PM schedule, the work orders, and the failure events in one system, it can show you the easy metric and the hard one together — and connect a failure back to the service that should have caught it. The features below are what turn a green compliance report into a real reliability picture.
-
PM Compliance Tracking
On-time PM completion rate per bus, per shop, per fuel type — the baseline metric, audit-ready for FMCSA and state DOT records.
-
MTBF & MTTR Trending
Mean time between failures and mean time to repair, trended over time — so you see reliability moving, not just a single snapshot.
-
Road-Call Analytics
Unplanned failures on route, per bus and per mileage band — the rawest read on whether PM is actually keeping buses running.
-
PM-to-Failure Correlation
Ties failures back to recent PM history, so a service that isn't catching a problem surfaces instead of hiding behind a green checkbox.
-
Cost-Per-Mile Trends
Maintenance cost per mile over time, so you can see effective PM bending the curve down by trading emergency repairs for planned work.
-
Fuel-Type-Aware PM Logic
Separate PM schedules for diesel, CNG, and electric buses, each tuned from its own failure history — effectiveness measured per powertrain.
The connection is what makes it work. A compliance percentage lives in a scheduler; effectiveness only exists when the failures are linked to the services meant to prevent them. Because it's all one platform, a road call on a recently-serviced bus doesn't disappear into a separate system — it lands next to the PM record that should have caught it, and the program gets smarter for it. Book a demo to see the compliance-and-effectiveness picture on one dashboard.
The Maintenance Manager's View
That's the difference in one story: a perfect compliance record sitting on top of a PM interval that was missing the failure by 5,000 miles. Compliance said everything was fine. Only the effectiveness data — failures correlated against PM history — showed where the program was actually leaking. Sign up free and see which of your PMs are missing their failures.
The Bottom Line on PM Compliance vs Effectiveness
PM compliance vs effectiveness comes down to this: compliance proves the work was done on time, effectiveness proves the work prevented the failure — and a fleet can hit 98% on the first while quietly failing the second. Compliance is a calendar percentage anyone can pull; effectiveness lives in the outcome signals — MTBF trend, road-call rate, PM-to-failure correlation, and cost per mile — that only appear when failures are linked back to the services meant to prevent them. Track both, run the tuning loop that turns real failures into a smarter schedule, and you stop mistaking a green report for a reliable fleet. That's the shift from doing PM to doing PM that works. Book a walkthrough to see PM effectiveness measured on a fleet like yours.