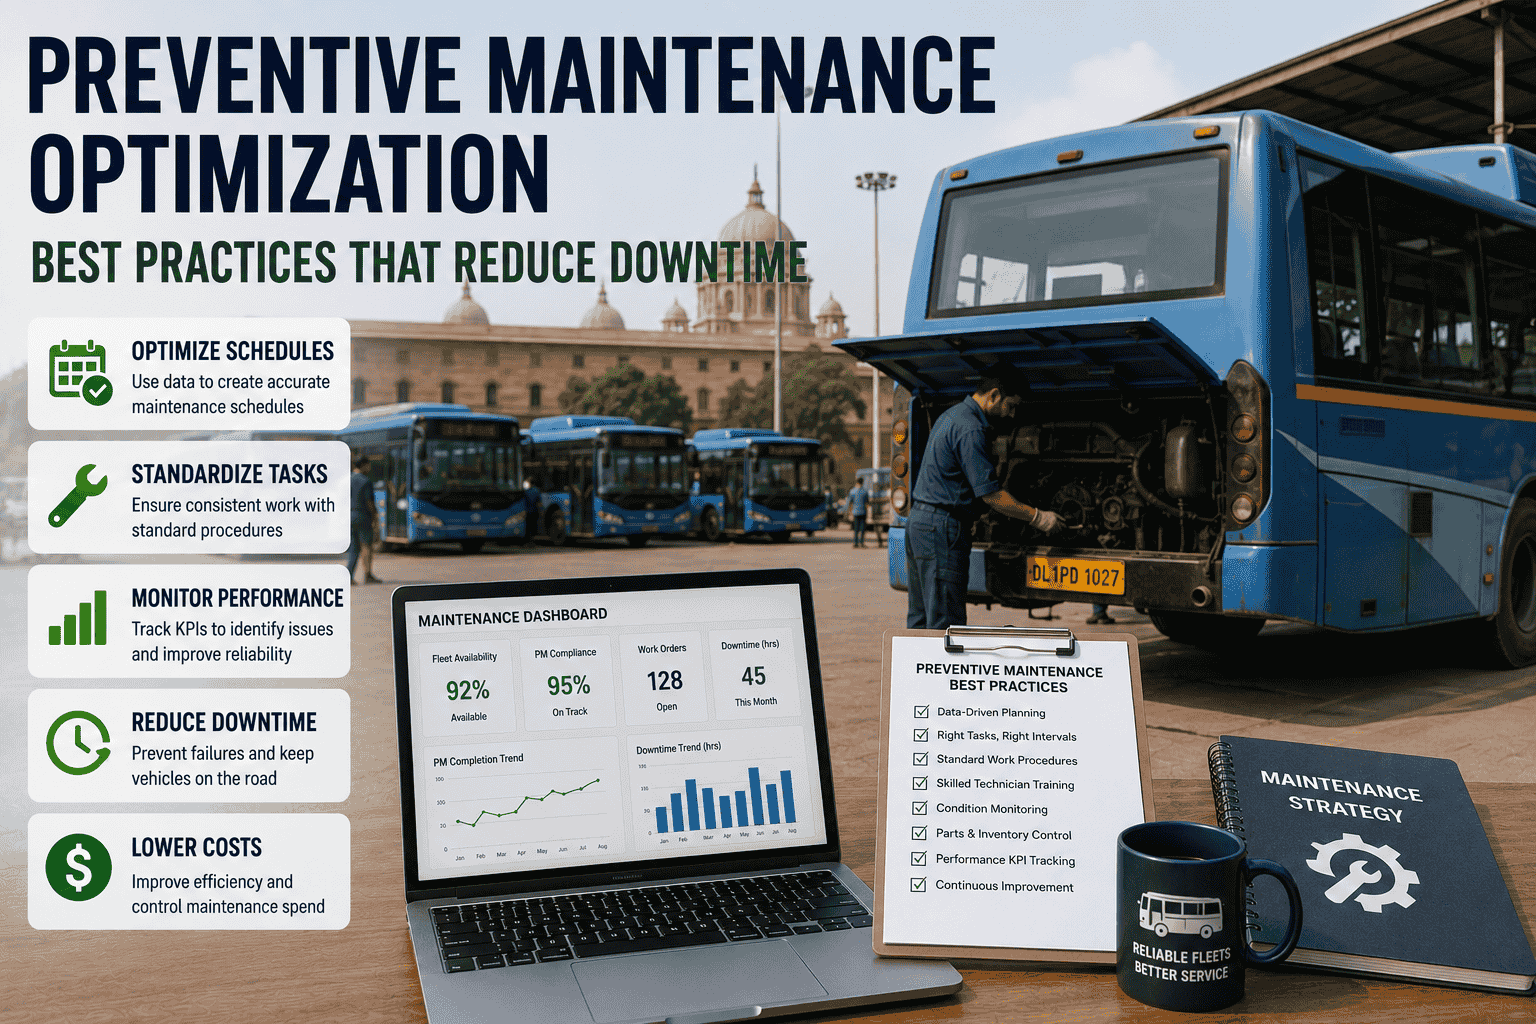
Preventive maintenance optimization is the difference between a fleet that stays ahead of failures and a fleet that keeps reacting to them. Many bus fleets have PM schedules, but those schedules are often static, outdated, or based only on mileage. That creates two expensive problems: over-maintenance on low-risk vehicles and under-maintenance on high-risk vehicles. A stronger preventive maintenance program uses usage data, inspection history, downtime trends, work order patterns, technician notes, and asset condition to decide what should be serviced, when it should be serviced, and which vehicles need priority attention. In 2026, fleet managers need more than a calendar-based PM plan. They need an optimized PM workflow that reduces downtime, improves uptime, controls maintenance costs, and gives leadership clear KPI visibility. This guide explains practical preventive maintenance optimization best practices that help bus fleets reduce breakdowns, improve compliance, and lower operating costs.
Use data, CMMS workflows, inspection trends, work orders, and maintenance KPIs to optimize preventive maintenance and keep buses available for service.
A preventive maintenance optimization program begins with a clear baseline. Fleet managers need to know how often PMs are completed on time, which buses miss scheduled service, which components fail repeatedly, and how much downtime is caused by preventable defects. Without a baseline, optimization becomes guesswork. The first step is to pull the last 12 months of work orders, inspection failures, road calls, missed PMs, parts usage, and vehicle downtime. This reveals where the fleet is losing reliability.
The most important baseline KPIs are PM compliance rate, mean time between failures, average downtime per bus, emergency work order percentage, cost per mile, repeat repair rate, and inspection defect closure time. A fleet with 70% PM compliance and high emergency work orders should not start with advanced predictive analytics. It should first fix schedule discipline, technician assignments, overdue alerts, and inspection-to-work-order conversion.
Traditional PM schedules often use a fixed mileage or time interval for every vehicle. That is easy to manage, but it ignores real-world operating conditions. A school bus doing short stop-and-go routes experiences different wear than a transit bus running long highway miles. A bus on hilly routes wears brakes faster. A bus with repeated cooling system defects needs closer inspection than a newer unit with clean history. Risk-based PM intervals adjust service frequency using actual vehicle condition and usage data.
Risk-based optimization does not mean skipping maintenance. It means prioritizing maintenance intelligently. High-risk vehicles get shorter PM intervals, deeper inspections, and earlier component replacement. Low-risk vehicles stay on standard intervals without unnecessary extra service. This reduces both breakdowns and wasted labor.
One of the biggest PM failures happens between inspection and repair. Drivers report defects, technicians review them later, supervisors assign work manually, and some items fall through the cracks. A modern preventive maintenance workflow turns every inspection defect into a trackable work order. If a driver reports brake noise, coolant smell, low tire pressure, loose mirror, lighting issue, or door malfunction, the system should create a work order automatically with severity, photos, vehicle ID, driver notes, and timestamp.
This improves accountability because every defect has an owner, status, due date, and closure record. It also improves PM planning because recurring defects can be grouped with upcoming PM service. Instead of repairing one issue today and pulling the bus again next week for PM, maintenance teams can bundle work and reduce downtime.
Defect captured with notes and photo.
CMMS creates repair task instantly.
Critical defects route to technician queue.
Technician documents labor, parts, and completion.
Preventive maintenance optimization works only when KPIs are reviewed frequently. Quarterly reporting is too slow because a fleet can build a large backlog in 90 days. Weekly KPI reviews help managers catch overdue PMs, rising downtime, technician bottlenecks, repeat repairs, parts shortages, and high-cost vehicles before they become operational problems.
The best weekly dashboard includes PM compliance, overdue PM count, open work orders by priority, average repair cycle time, bus availability percentage, repeat defects, road calls, and parts stockout incidents. These KPIs should be visible to maintenance supervisors, operations managers, and leadership so everyone understands the reliability picture.
Preventive maintenance can still fail if the required parts are not available. A bus comes in for PM, the technician discovers brake components, filters, belts, sensors, or lighting parts are needed, but inventory is empty. The bus then sits waiting for parts, turning planned maintenance into avoidable downtime. PM optimization must include parts forecasting.
CMMS data should show which parts are used most often during PM, average consumption rate, reorder points, vendor lead time, and stockout frequency. High-use PM parts should have min-max levels. Critical safety parts should never be managed manually. Parts planning turns PM from a scheduling activity into a readiness workflow.
Preventive maintenance optimization is not about doing more maintenance. It is about doing the right maintenance at the right time on the right bus. Fleets should combine PM schedules, inspection data, work orders, downtime history, and parts availability into one workflow. The result is fewer surprises, better uptime, lower repair costs, and stronger compliance documentation.
Optimized preventive maintenance reduces downtime by making maintenance measurable, risk-based, and connected to real fleet conditions. Start with a baseline, adjust PM intervals by vehicle risk, turn inspection defects into work orders, review KPIs weekly, and forecast parts before buses enter the shop. A CMMS makes these practices repeatable so fleet managers can reduce breakdowns, control costs, improve uptime, and show leadership clear maintenance performance data.