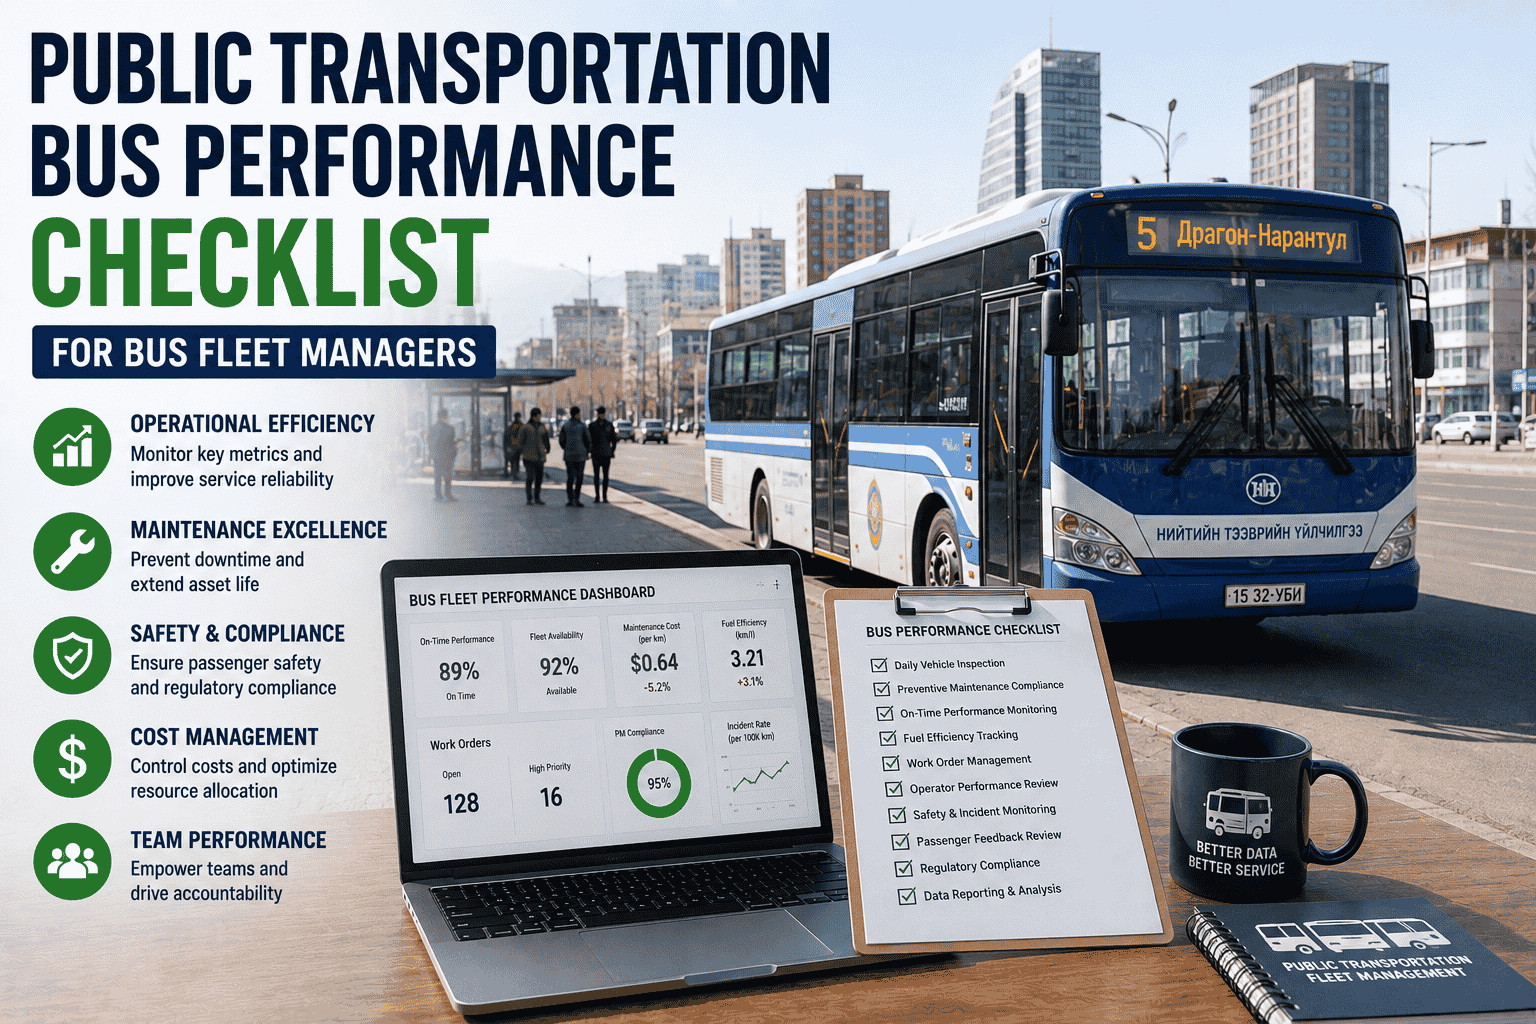
Public transportation bus performance is measured by more than whether buses leave the depot. Fleet managers must track on-time pullout, preventive maintenance compliance, road calls, repeat defects, inspection pass rates, work order closure time, technician productivity, fuel or energy efficiency, and asset availability. Without a standardized checklist, performance management becomes reactive: buses are fixed after they fail, routes are delayed after defects appear, and leadership only sees problems after service reliability drops. A strong public transportation bus performance checklist gives managers a weekly operating rhythm. It turns maintenance, inspection, and dispatch data into clear actions: which buses need attention, which routes create excessive wear, which defects repeat, which technicians need support, and which KPIs are moving in the wrong direction. This guide shows how transit fleets can use data, automation, and standardized operating procedures to improve bus performance and reduce operational risk.
Use this 2026 checklist to manage public transportation bus performance with data, automation, maintenance KPIs, and standardized fleet operating procedures.
The first mistake public transportation fleets make is tracking too many numbers without a clear operating checklist. A useful checklist focuses on KPIs that predict reliability. Start with seven core metrics: on-time pullout rate, vehicle availability, preventive maintenance compliance, road calls per 10,000 miles, inspection pass rate, repeat defect rate, and average work order closure time. These metrics show whether the fleet is ready for service, whether maintenance is proactive, and whether repairs are truly solving problems.
Review these KPIs every week with maintenance, dispatch, and operations leadership. A bus that misses pullout creates immediate passenger disruption. A missed PM creates future breakdown risk. A repeated defect shows poor root-cause diagnosis. A slow work order closure rate may indicate parts shortages, technician overload, or weak prioritization. When the checklist connects KPIs to owners and actions, performance improves consistently.
Measures whether buses are ready when scheduled service begins.
Shows whether preventive maintenance is completed before due dates.
Tracks breakdown frequency and service disruption risk.
Highlights repairs that did not address the root cause.
A trend graph helps fleet managers explain performance improvement to leadership. Instead of saying the maintenance program is improving, show the relationship between PM compliance and road calls. In the example below, PM compliance rises from 78% to 96% over six months while road calls fall from 5.6 to 1.8 per 10,000 miles. This is the performance story leadership understands: disciplined maintenance reduces service disruption.
Performance does not improve only because the fleet has better software. It improves when software supports repeatable operating procedures. Standard operating procedures should define who reviews daily DVIR defects, who approves work orders, how critical defects are escalated, when buses are removed from service, how parts shortages are reported, and how repeat failures are investigated.
Every public transportation fleet should have a daily, weekly, and monthly operating rhythm. Daily checks focus on pullout readiness and active defects. Weekly checks focus on PM compliance, open work orders, road calls, and repeat defects. Monthly reviews focus on cost per mile, asset lifecycle, technician productivity, vendor performance, and route-level wear patterns. This rhythm prevents managers from reacting to yesterday's breakdown while missing tomorrow's warning signs.
Review open safety defects, buses unavailable for pullout, critical parts shortages, and road-call incidents.
Review PM compliance, inspection pass rate, work order backlog, repeat defects, and technician workload.
Review cost per mile, lifecycle risk, vendor performance, asset replacement needs, and route wear trends.
Confirm every bus has current inspection status, open defect status, PM due date, and asset availability status.
Track on-time pullout daily and connect missed pullouts to maintenance, parts, driver, or dispatch causes.
Review PM compliance weekly and escalate any PM that becomes overdue before the next service window.
Flag repeat defects by vehicle, component, technician, and vendor to identify root-cause repair gaps.
Measure road calls per 10,000 miles and separate preventable failures from unavoidable incidents.
Review inspection failure categories monthly: brakes, tires, lights, steering, suspension, doors, and emergency equipment.
Use route-level data to identify high-wear routes causing abnormal brake, tire, suspension, or energy consumption patterns.
What is the most important KPI for public transportation bus performance?
How often should fleet managers review performance metrics?
How does CMMS improve public transit performance?
What causes poor bus performance in transit fleets?
What is a good road call target?
Public transportation bus performance improves when managers use a repeatable checklist backed by real data. Track on-time pullout, PM compliance, vehicle availability, inspection pass rates, road calls, repeat defects, and work order closure time. Review them on a fixed rhythm and assign every issue to an owner. A CMMS makes this process easier by connecting inspections, maintenance, parts, assets, and reporting in one workflow.







